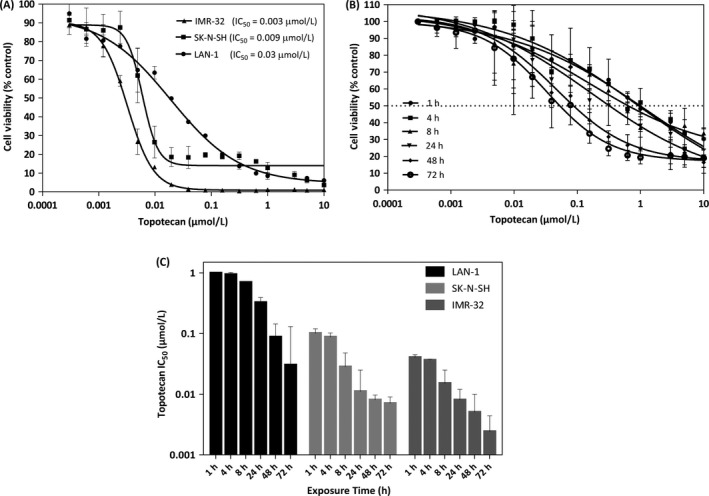
Figure 1.

Topotecan is a potent drug when used against IMR‐3, SK‐N‐SH and LAN‐1 neuroblastoma cell lines. Dose‐response curves for topotecan (panel A) were determined in neuroblastoma cell lines using PrestoBlue® as described in the Methods. The IC 50 for the drugs are indicated. Changes in LAN‐1 cell viablity as a function of different topotecan exposure times (panel B) were determined. The IC 50 as a function of topotecan exposure time for each cell line are summarized in panel C. Results are compared to untreated controls and presented as the mean ± SD of at least three independent experiments performed in triplicate.
