
Figure 2.
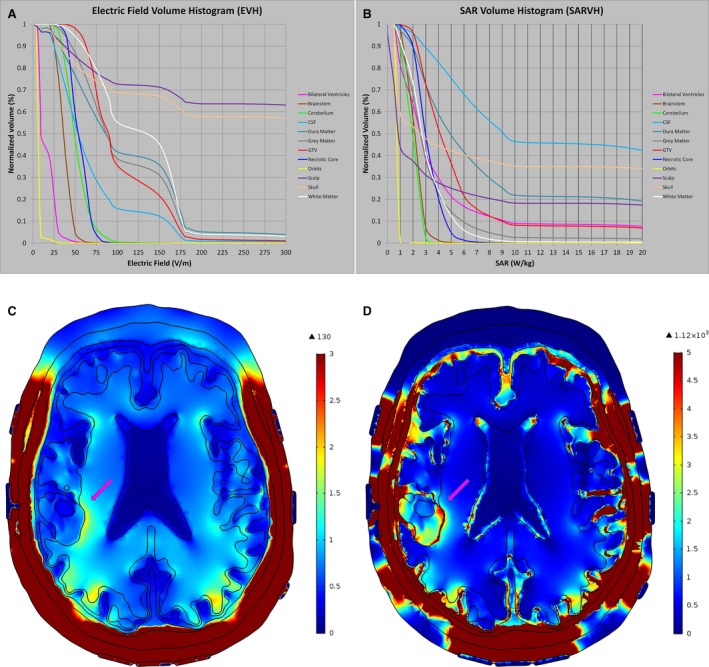
Volume histograms EVH and SARVH. The EVH (A), SARVH (B), electric field map (C), and SAR map (D) were generated using the transducer array placement as outlined in Figure 3E. The highest EAUC was found at the scalp and skull, whereas the lowest was detected at the orbits, bilateral ventricles, and brainstem. The highest SARAUC was found at the skull, GTV, and the layer of cerebrospinal fluid between cortex and dura, whereas the lowest was found in the orbits, cerebellum, and the orbits. EVH, electric field–volume histogram; SARVH, specific absorption rate–volume histogram; SAR, specific absorption rate.