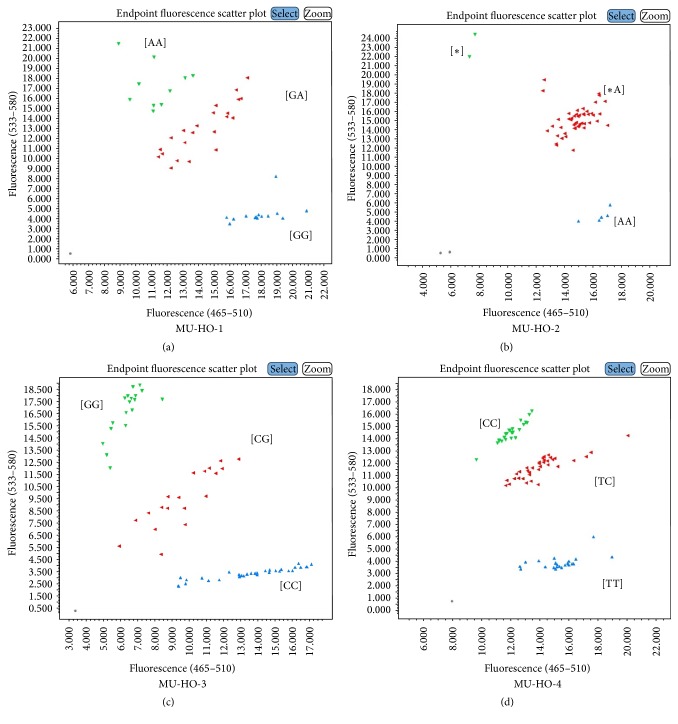
Figure 1.
Endpoint fluorescence genotyping plots for high oleic (HO) acid trait. (a) FAD2-1A_17D where [GG] is wild-type with normal oleic acid content and [AA] is mutant with elevated oleic acid content; (b) FAD2-1A_Del where [AA] is wild-type with normal oleic acid content and [∗] is mutant with elevated oleic acid content; (c) FAD2-1B_327 where [CC] is wild-type with normal oleic acid content and [GG] is mutant with elevated oleic acid content; (d) FAD2-1B_I143T where [TT] is wild-type with normal oleic acid content and [CC] is mutant with elevated oleic acid content.

