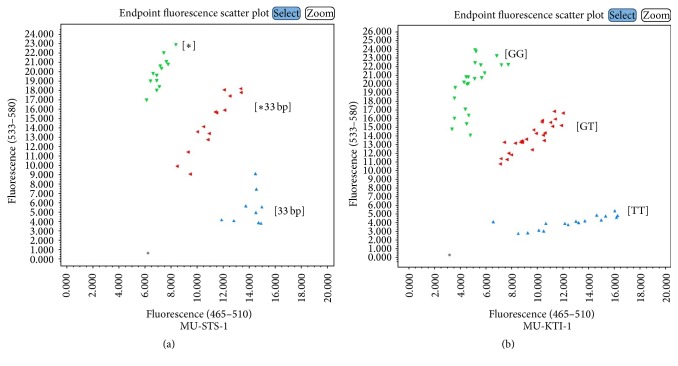
Figure 3.
Endpoint fluorescence genotyping plots for trait for (a) stachyose synthase (STS) where [∗] is mutant allele with reduced stachyose and [33 bp] is wild-type allele with normal stachyose concentration; (b) Kunitz trypsin inhibitor (KTI) where [GG] is wild-type allele with normal trypsin and [TT] is mutant allele with reduced trypsin content.

