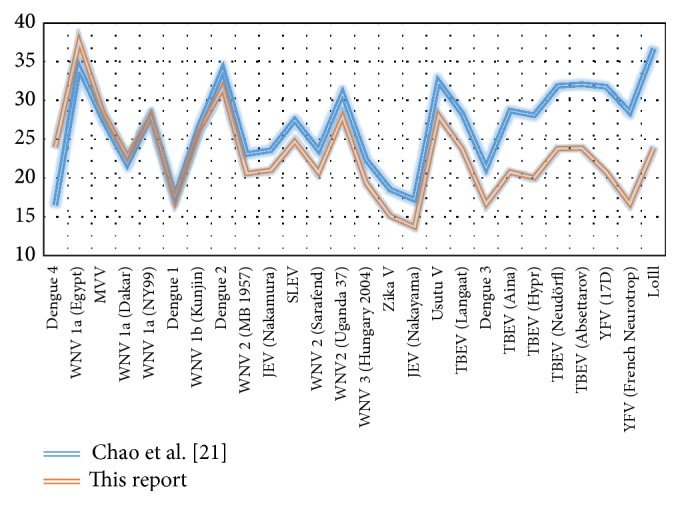
Figure 1.

Cq values for 26 viruses. Comparison of Cq values obtained for different viruses using the protocol of Chao et al. [21] (blue line) with those of our own procedure (red line). The same virus RNA preparation was tested in the same PCR plate with both RT-qPCR protocols. The order of viruses from left to right is according to increasing Cq difference.
