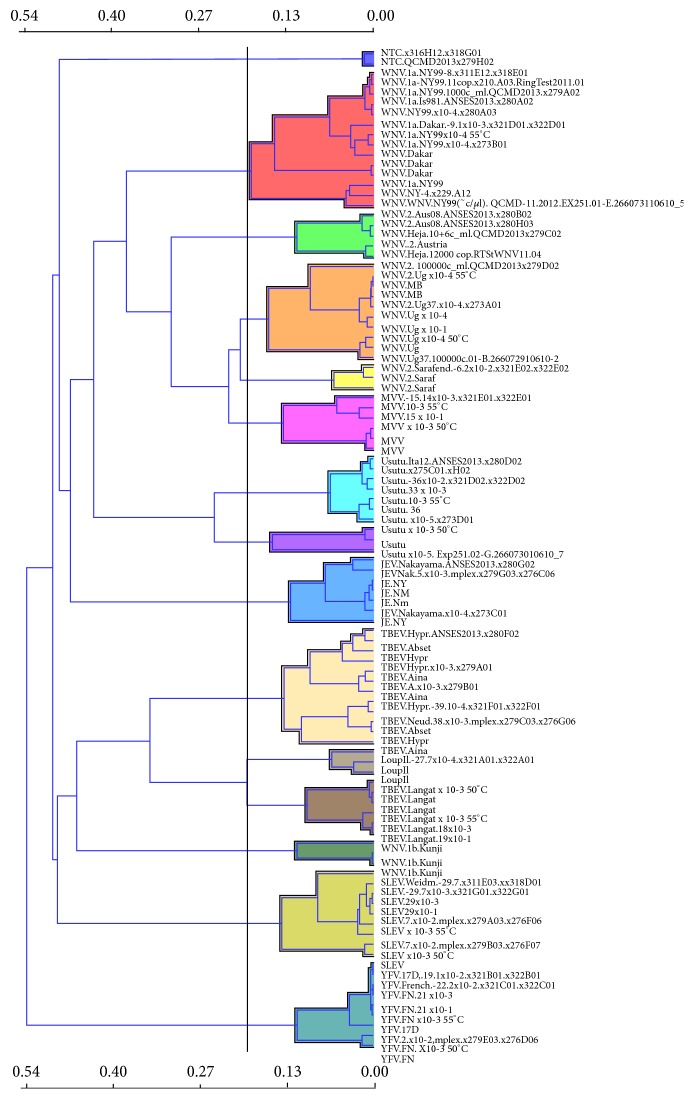
Figure 4.
Cluster analysis of tested samples. Output of the tree widget in Orange software. A cluster analysis was conducted using the distances between the hybridization patterns of experimentally tested samples. This is the preferred method to visualize the identification of viruses in samples that contain only one Flavivirus.

