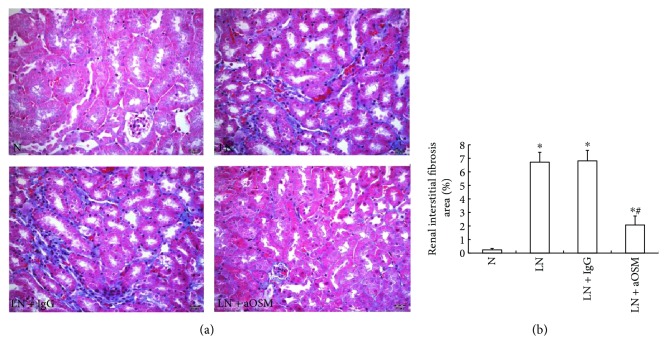
Figure 6.
Pathological changes in renal interstitial fibrosis observed by Masson staining. (a) Anti-OSM antibody treatment reduced the blue area. (b) The data are expressed as the mean ± SD. N = normal control mice; LN = lupus nephropathy mice; LN + IgG = LN mice treated with normal IgG; LN + aOSM = LN mice treated with anti-OSM antibody. ∗P < 0.05 versus normal control mice (N); #P < 0.05 versus lupus nephropathy mice (LN).

