
Figure 1.
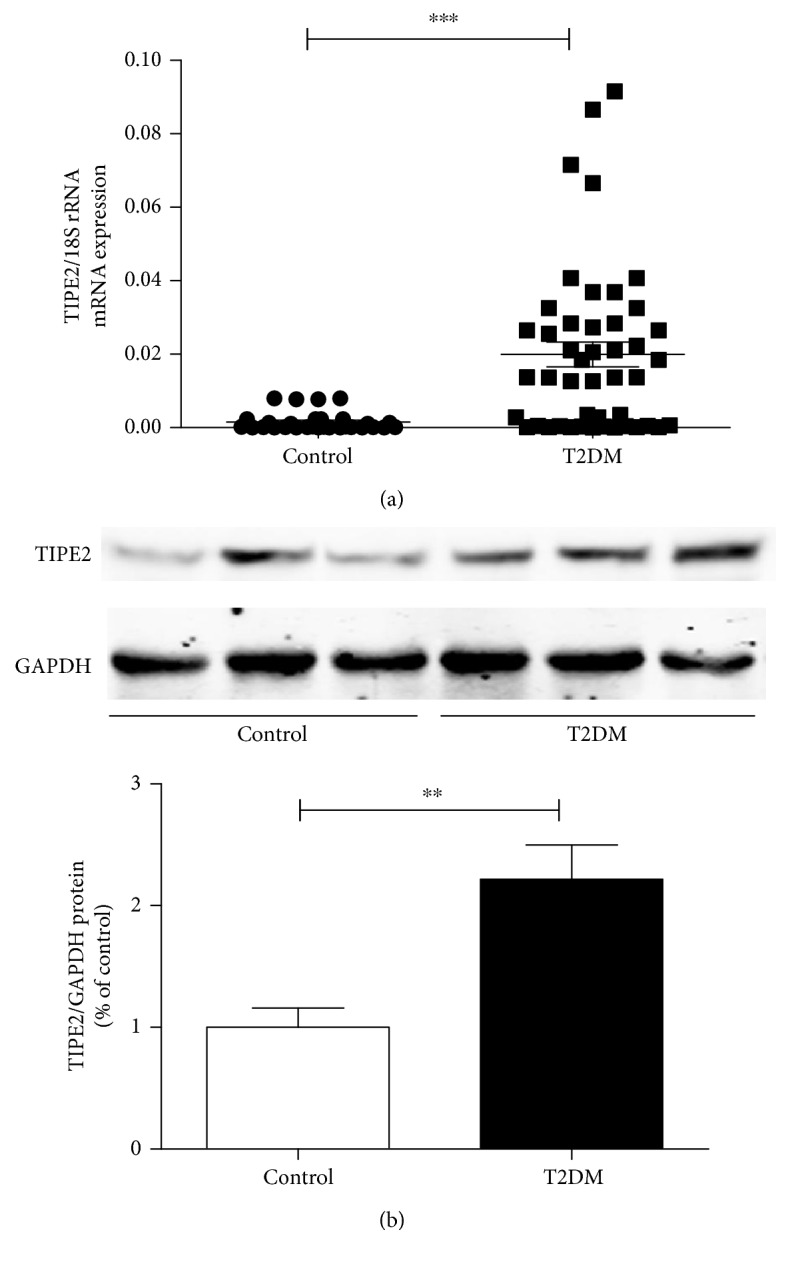
TIPE2 expression levels in PBMCs from individuals with T2DM and healthy participants. TIPE2 expression was determined by RT-PCR and Western blotting. The mRNA levels of TIPE2 were obviously higher in PBMCs from T2DM patients (n = 46) compared with those from healthy controls (n = 30) (a). Every point depicts a specific participant, and the median value is indicated for each group. Statistical comparisons were performed using the Mann–Whitney U test. The TIPE2 protein levels were obviously upregulated in PBMCs from T2DM patients compared with those from healthy controls (b). Representative results of three individual experiments were shown for the TIPE2 expression in PBMCs. ∗∗∗P < 0.001 versus control; ∗∗P < 0.01 versus control.