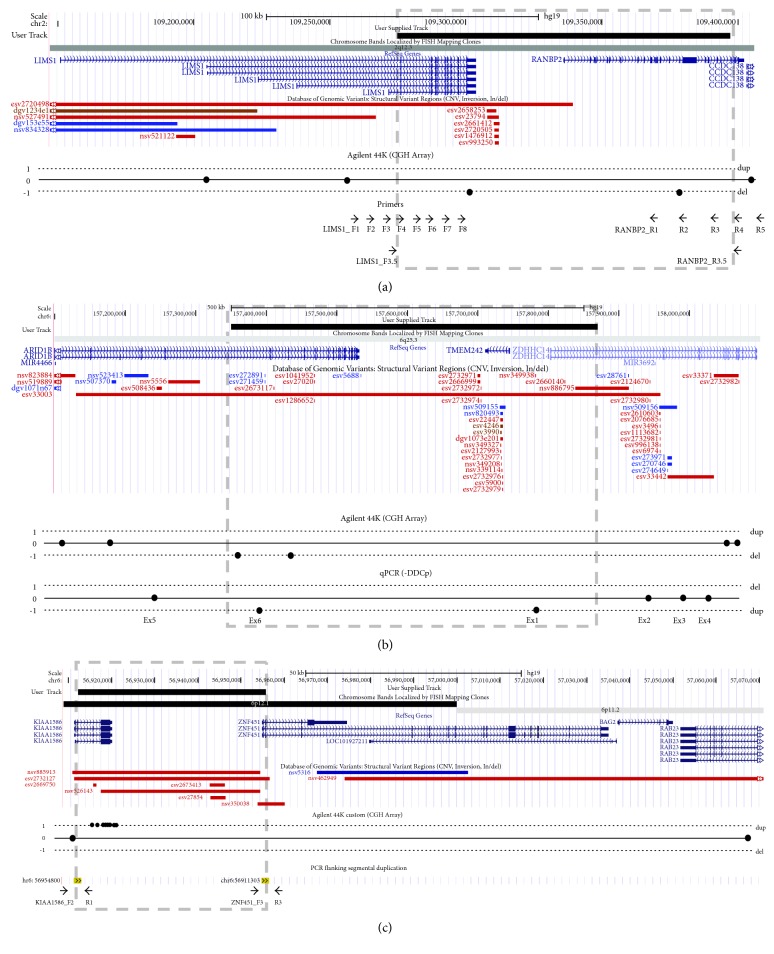
Figure 1.
Representation of the CNVs in patient 1 (a), patient 2 (b), and patient 3 (c). CNVs are showed by a black box above and the grey dashed box. Refseq genes and the CNVs annotated in the region are indicated in the middle. Diagram of the array-CGH results and the strategies to detect the chimeric gene are showed below: the primers used to locate the breakpoint in patient 1 (a), the qPCR results in the exons of affected genes of patient 2 (b), and the primers flanking the segmental duplication in patient 3 (c).

