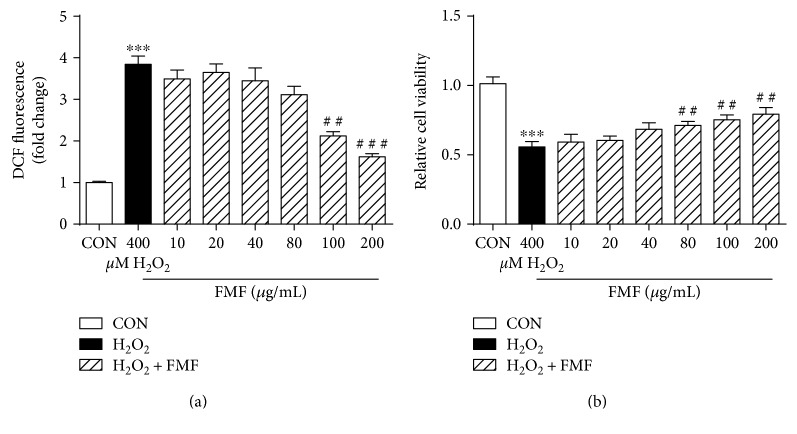
Figure 2.
Effects of FMF on H2O2-mediated oxidative stress in HepG2 cells. Cells were treated with FMF (10, 20, 40, 80, 100, and 200 μg/mL) in the presence of 400 μM H2O2 for 4 h. (a) ROS formation was measured using a fluorescence microplate reader. (b) Cellular mortality was evaluated by MTT assay. Results are shown as mean ± SD (n = 3). ∗∗∗P < 0.001 compared with the control group; ###P < 0.001, ##p < 0.01 compared with H2O2-intoxicated group.

