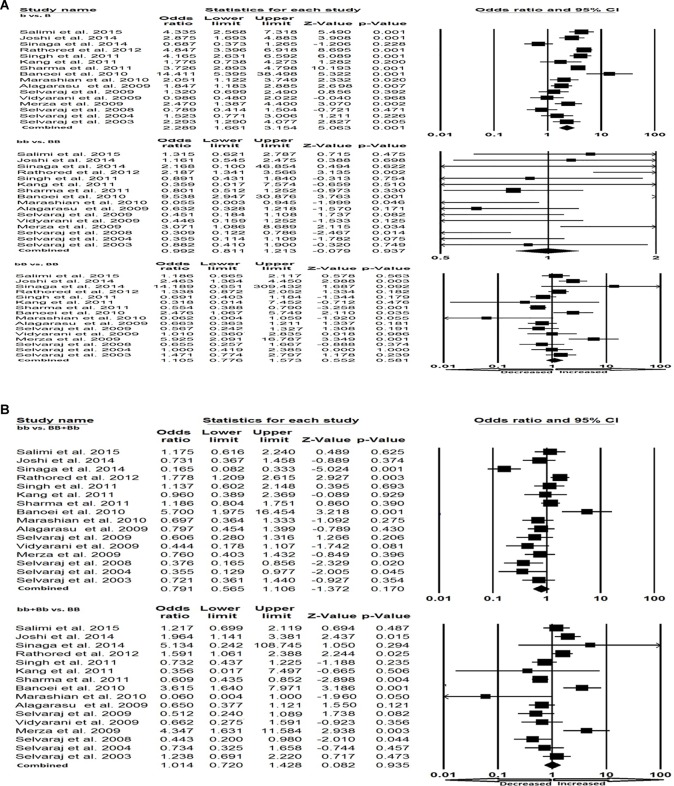
Figure 5. Forest plot.
(A) Forest plot for the Asian population (b compared with B; bb compared with BB; bB compared with BB) showing OR with 95% CI to evaluate the association of the VDR BsmI (rs1544410) gene polymorphism and PTB risk. (B) Forest plot for the Asian population (bb compared with BB + Bb; bb + Bb compared with BB) showing OR with 95% CI to evaluate the association of the VDR BsmI (rs1544410) gene polymorphism and PTB risk.

