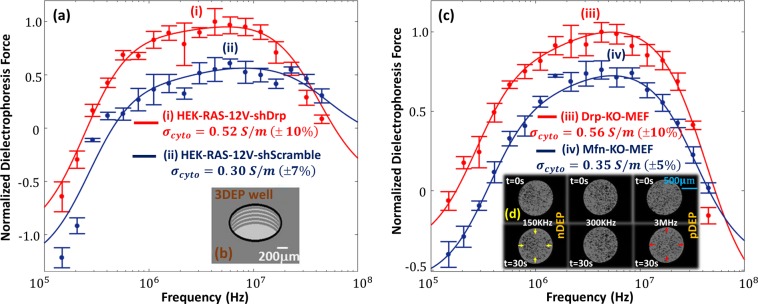
Figure 4.
Dielectrophoretic frequency spectra of (a) oncogenic HRas-modified HEK cells expressing Drp1 shRNA (i) vs scramble control shRNA (ii) and (c) MEFs lacking Drp1 (iii) vs those lacking mitochondrial fusion GTPases Mfn1 and Mfn2 (iv). Respective fixed cell images are in Figure 3. DEP spectra were measured at σm of 0.15 S/m in a 3DEP reader using 20 individual wells with ring electrodes (b) to measure relative DEP force levels based on spatiotemporal variations in light scattering, as per example images shown in panel d for nDEP at 150 kHz, no DEP at 300 kHz, and pDEP at 3 MHz field frequencies.

