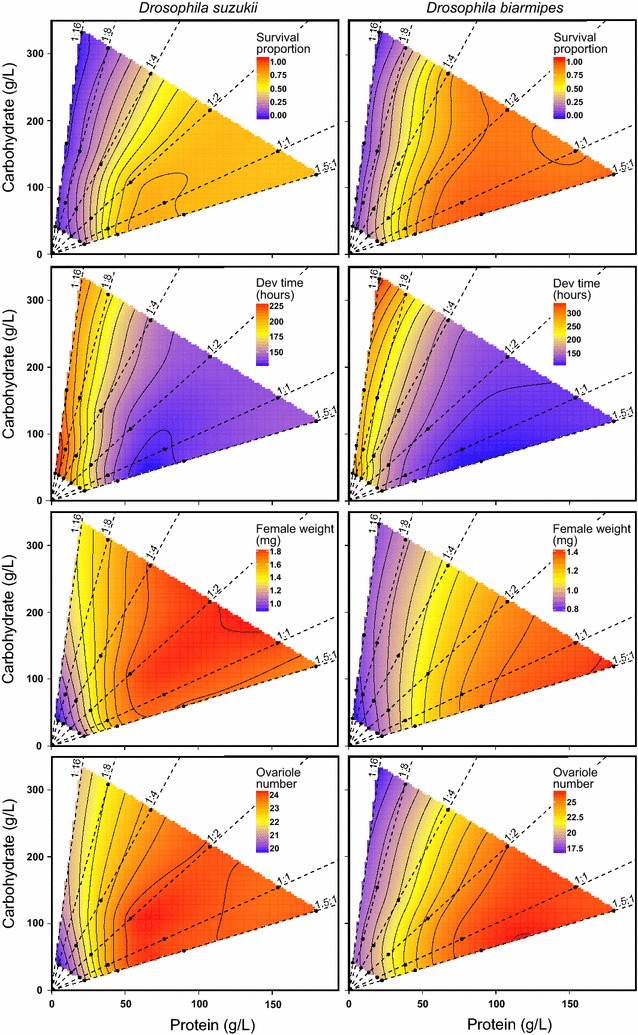
Fig. 1.

The effects of protein and carbohydrate content of the larval diet on four larval life-history traits of D. suzukii (left column) and D. biarmipes (right column). The fitted response surfaces of the effects of 24 different diets varying in protein, carbohydrate, and caloric composition for: (first row) proportion of larvae surviving from first instar larvae to pupae; (second row) developmental time from first instar larvae to pupae; (third row) female pharate weight; and (fourth row) total number of ovarioles of adult females. Dashed black lines represent the P:C ratios. We replicated four times each block of 24 diets per species using 30 first instar larvae per diet. Filled black circles represent the respective nutritional coordinates of each of the 24 diets used (if a dot is absent not enough larvae survived that treatment to measure the trait)
