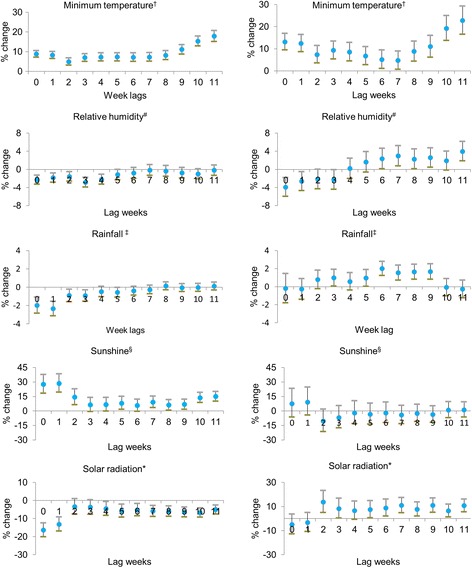
Fig. 4.

Poisson regression model of weather variables and weekly number of HFRS (left) and leptospirosis (right) cases from 2001 to 2009 in selected Korean provinces. The figure indicates the lag in weeks between HFRS and leptospirosis cases with climatic factors. The Poisson regression model shows the relation of climatic factors in 12 weekly lag durations in the development of HFRS and leptospirosis starting from week 27 to the last week of the year (53).†weekly average daily minimum temperature (°C), #weekly average daily minimum humidity (%), ‡weekly average daily rainfall (mm), §weekly average daily sunshine (hours), *weekly average solar radiation (mJ/m2). Percent change of risk and 95% CI were estimated using a regression coefficient (β) and the following equation: percent change of risk = (exp[β] - 1) × 100 and 95% CI = (exp[β] - 1 ± 1.96 × standard error)
