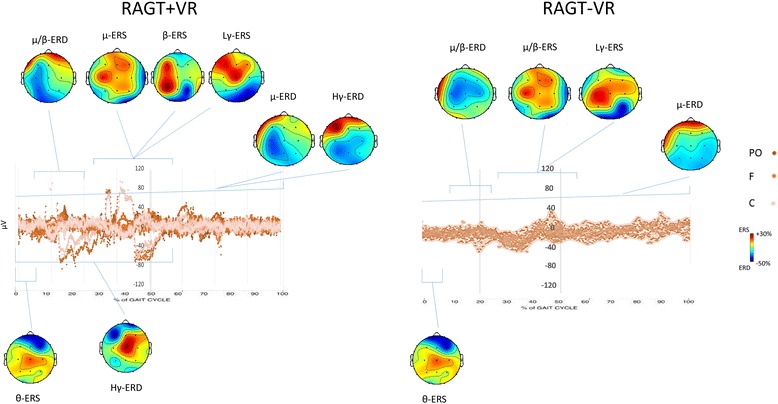
Fig. 5.

Average changes at TPOST as compared to TPRE in scalp ERP projections relatively to the full gait cycle. The left and right hemispheres plots correspond to the affected and unaffected ones, respectively. ERS and ERD are masked in red and blue tones, respectively, whereas non-significant differences are in green (see Table 5)
