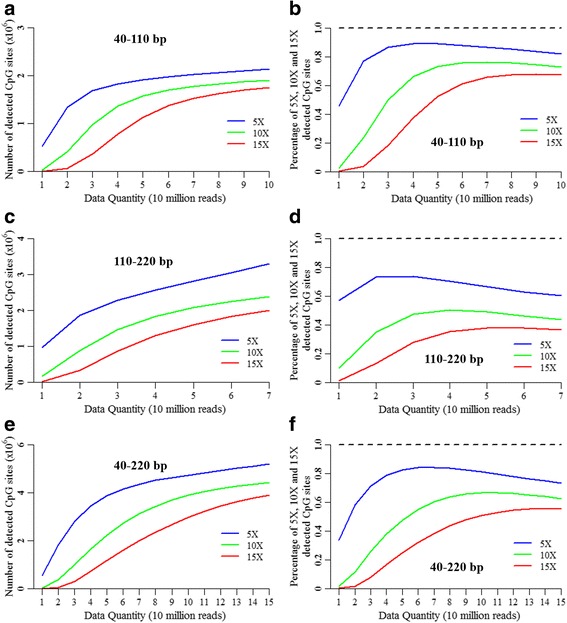
Fig. 3.

Distributions of detected CpG sites in the differently sub-sampled RRBS data. The number distributions of detected CpG sites with ≥5, 10 and 15 covered reads (5X, 10X and 15X) in the differently sub-sampled RRBS data for 40–110 bp (a), 110–220 bp (c) and 40–220 bp (e) fragment sizes in triplications. The percentages of 5X, 10X and 15X detected CpG sites over the 3× detected CpG sites in the differently sub-sampled RRBS data for 40–110 bp (b), 110–220 bp (d) and 40–220 bp (f) fragment sizes in triplications
