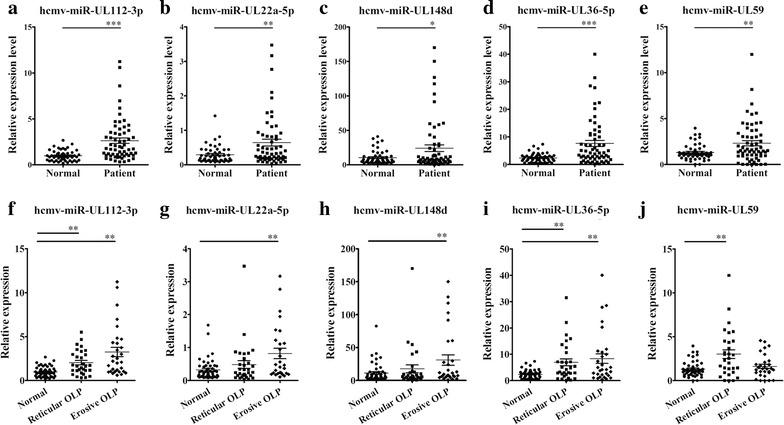
Fig. 3.

Plasma levels of the 5 upregulated miRNAs in different types of OLP. a–e In training set and validation set, the relative expression levels of 5 HCMV-encoded miRNAs were measured in 61 OLP patients and 51 healthy controls using a RT-qPCR assay, each P-value was derived from a 2-sided Student’s t test; f–j The relative expression levels of 5 upregulated HCMV-encoded miRNAs in 30 erosive OLP patients and 31 reticular OLP patients and 51 healthy controls were measured using RT-qPCR, each P value was derived from ANOVA analysis. The relative content of miRNA was calculated using the 2−∆Cq method. The relative expression of miRNAs was normalized to U6 expression. *P < 0.05; **P < 0.01
