
Fig. 3.
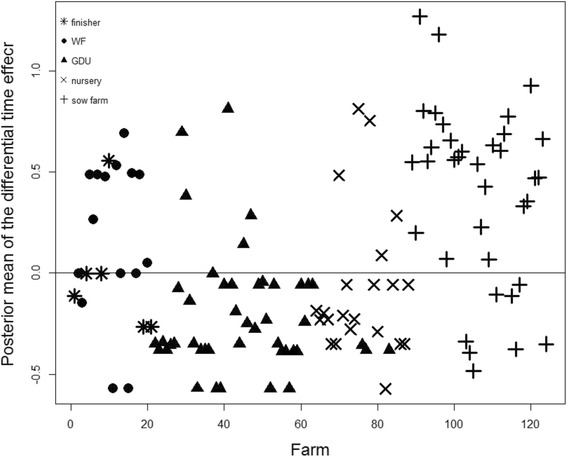
Posterior mean of the differential time effect (δ i) for reported PRRS cases of 124 farms from 2012 to 2015. If δ i < 0 then the farm specific trend is less steep than the mean trend, whilst δ i > 0 implies that the farm specific trend is steeper than the mean trend. Star, Circle, triangle, multiply and plus represent finisher, WF, GDU, nursery and sow farm, respectively