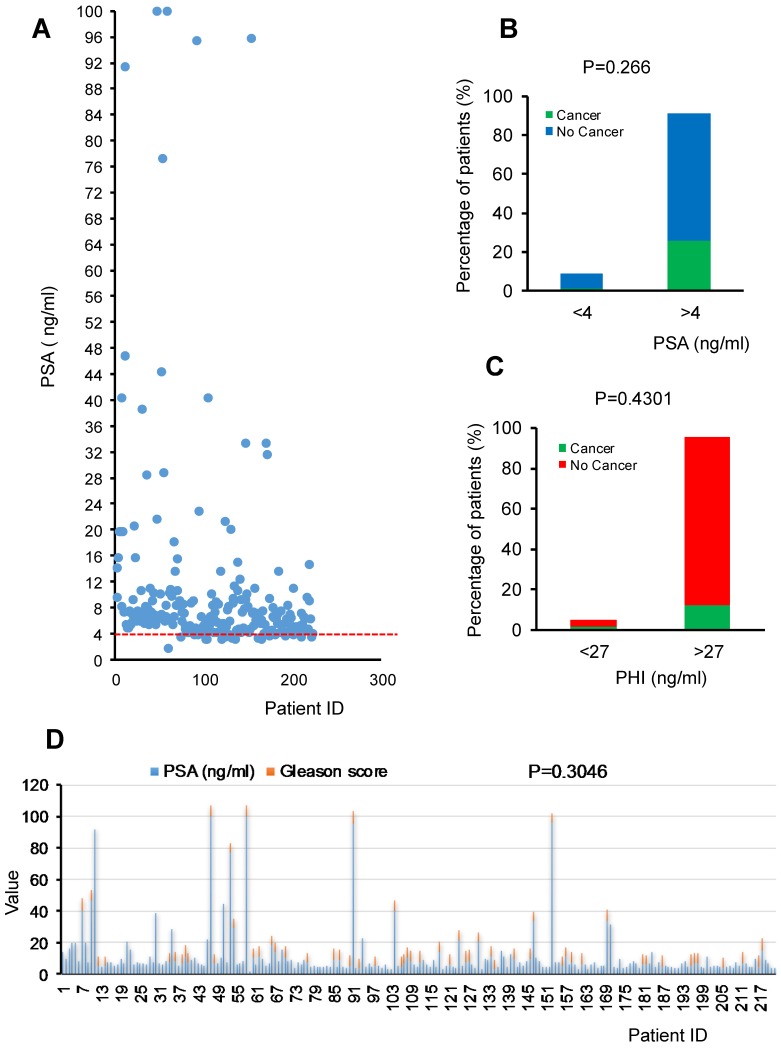
Figure 1.
Levels of PSA, PHI, and Gleason grade of prostate cancer patients from Kazakhstan. A. The distribution of PSA in Kazakhstani patients of the cohort study. B. The percentage of patients with different levels of PSA (<4ng/ml and >4ng/ml) or PHI (<27ng/ml and >27ng/ml). C. Chi-square analysis showed the P value. D. The distribution of PSA and Gleason score in prostate cancer patients in the cohort study. Spearman's correlation analysis showed the P value is 0.3046.

