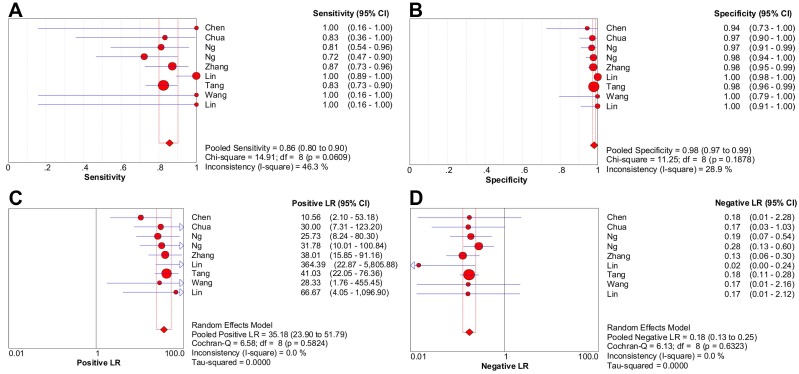
Figure 2.
Forest plots of 18F-FDG PET/CT on a per-patient basis in sensitivity (A), specificity (B), positive likelihood ratio (C), and negative likelihood ratio (D). CI: confidence interval; LR: likelihood ratio. Circles are the point estimates of studies with the 95% CIs indicated by horizontal bars. The size of the circles indicates the weight of each study. Diamonds are the summary estimates from the pooled studies with the 95% CIs indicated by horizontal bars. All pooled results were slightly different from the results reported in the text because of rounding.

