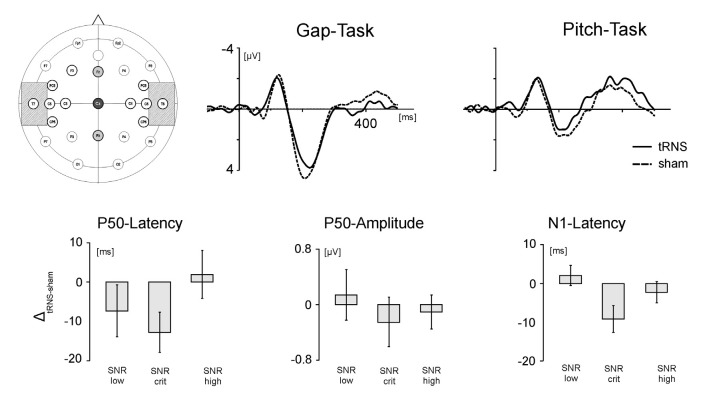
Figure 4.
Electrode positioning and EEG results. Upper panel. Left: positioning of the tRNS electrodes over T7 and T8 (crosshatched) and the EEG electrodes over Fz, Cz and Pz. Middle: grand average ERPs during processing of stimuli adjusted to the critical SNR in the gap task. Right: grand average ERPs during processing of stimuli adjusted to the critical SNR in the pitch task. Solid lines represent activation in the tRNS condition, dashed lines activation in the sham condition. Lower panel: tRNS compared to sham modulation of the auditory ERPs for stimuli with low SNR, critical SNR and high SNR. From left to right: latency of the P50 component, amplitude of the P50 component and latency of the N1 component. Error bars represent standard errors (SE).

