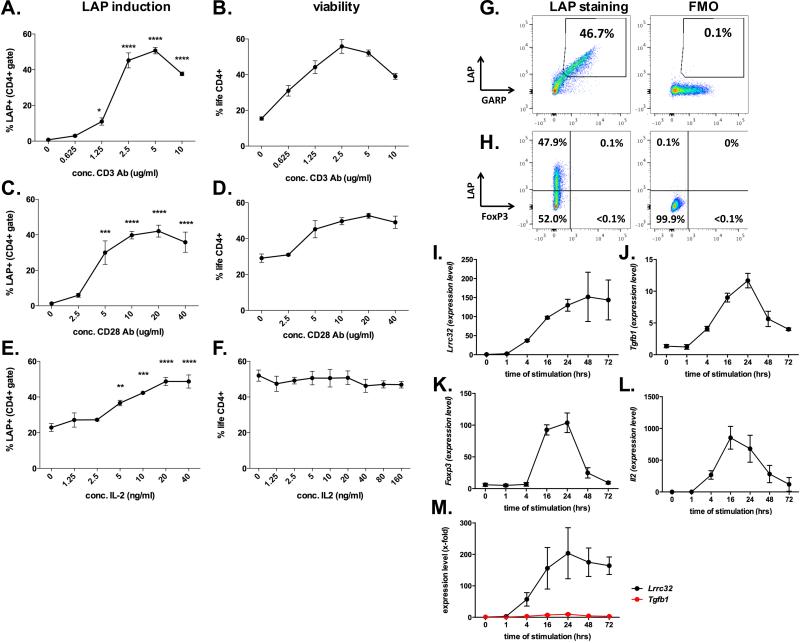
Fig. 1. In vitro induction of membrane bound TGF-β on naïve CD4+ T cells.
A-F. Percentage of LAP+ (A, C, E) and life CD4+ (B, D, F) T cells after culture of naïve CD4+ T cells with different titrations of plate bound anti-CD3 mAb (A, B), plate bound anti-CD28 mAb (C, D) and soluble IL-2 (E, F) keeping the other non-titrated variables constant (i.e. anti-CD3 mAb 1μg/ml, anti-CD28 mAb 10 μg/ml, IL-2 10 ng/ml). G-H. Representative dot blot showing LAP, GARP (G) and FoxP3 (H) staining as compared to FMO controls for LAP after three days of stimulation with anti-CD3 mAb (1μg/ml), anti-CD28 mAb (10 μg/ml) and IL-2 (10 ng/ml). I-L. Representative data from TaqMan PCR showing kinetics of gene expression of Lrrc32 (I; gene coding for GARP), Tgfb1 (J), Foxp3 (K) and Il2 (L) normalized to Gapdh under optimal conditions for LAP induction (anti-CD3 mAb 2.5μg/ml, anti-CD28 mAb 20 μg/ml, IL-2 20 ng/ml). M. X-fold induction of Llrc32 and Tgfb1 as compared to unstimulated naïve CD4+ T cells using data shown above (Fig.1I and K). Graphs show average values ± SEM for one representative experiment (out of three) with three independent samples. Statistical significant values are labeled: ***p<0.001, ****p<0.0001 (Ordinary one-way ANOVA with Tukey's multiple comparisons test)

