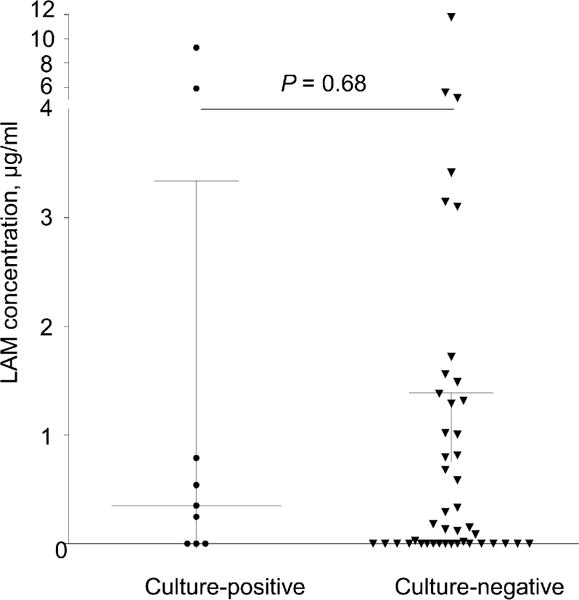
Figure 2.

Two-way scatter plot of induced sputum LAM concentrations (ng/ml) in M. tuberculosis culture-positive vs. negative sputum-scarce patients. Median (IQR) LAM concentrations are illustrated. According to the manufacturer, any LAM concentration > 0 ng/ml is considered to be a positive test. LAM = lipoarabinomannan; IQR = interquartile range.
