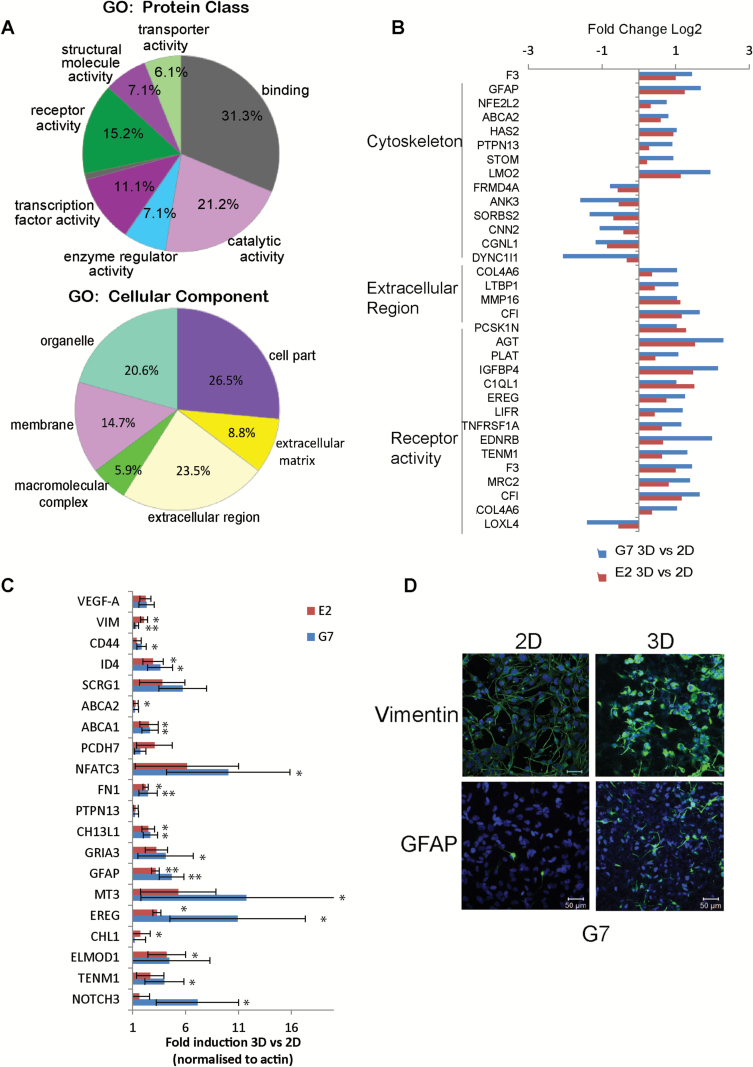
Fig. 6.
RNA-seq analysis of 3D versus 2D GSC cultures. (A) Gene ontology (GO) analysis of transcripts significantly upregulated in the 3D model in both G7 and E2 cultures. GO of molecular function (upper chart) and cellular components (lower chart) are represented. (B) Bar charts representing differentially expressed genes in 3D compared with 2D G7 and E2 cells within the cytoskeleton, extracellular matrix region, and receptor activity categories. (C) Real-time PCR validation of representative genes upregulated in the 3D GBM model. Bars represent mean±SD of cDNA expression from 3 independent experiments performed in duplicate. t-Test *P < .05; **P < .005. (D) Immunofluorescent images of vimentin (upper panel) and glial fibrillary acidic protein (lower panel) of G7 cells grown in either 2D or 3D conditions.

