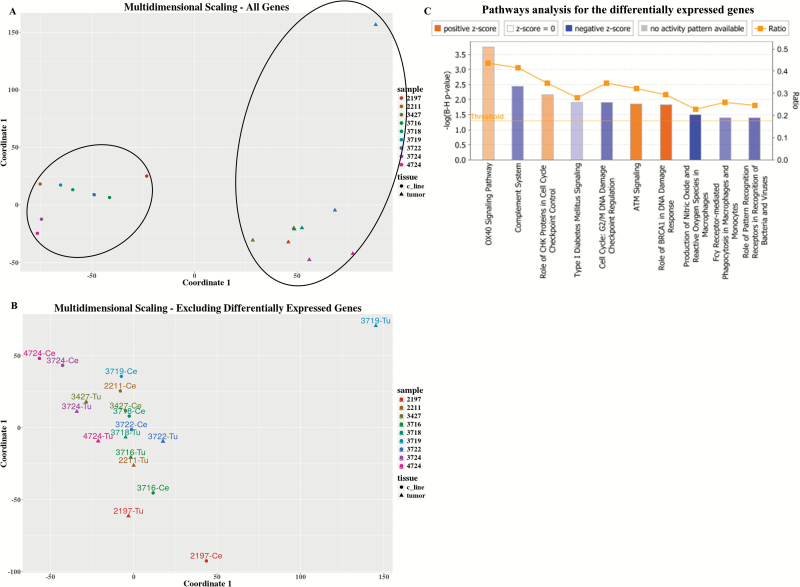
Fig. 3.
Transcriptome (array data) landscape. (A). MDS for all measured genes. Each sample is denoted by a different color, tumors are marked as triangles and PDCLs as circles. (B) MDS for all genes excluding 2643 differentially expressed genes between the tumor and PDCL groups. (C) Ingenuity pathway analysis for the 2643 differentially expressed genes. Only biological pathways that are both significant and for which the activation/inhibition direction could be inferred are shown. Orange denotes pathway activation in PDCL compared with parental tumors and blue denoted pathway inhibition.

