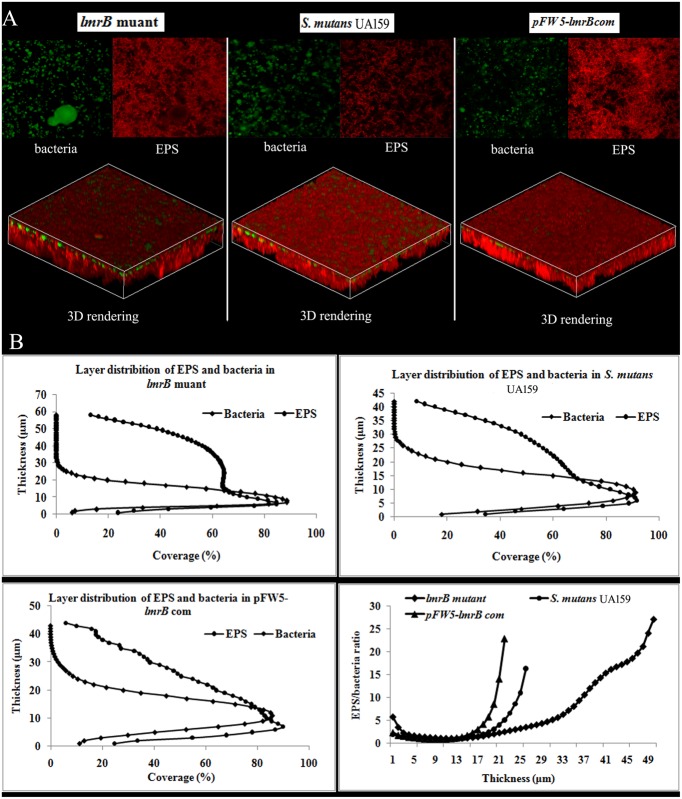
FIGURE 4.
Biofilm architecture and EPS distribution of S. mutans UA159 strains. (A) Representative double-labeling of 24 h S. mutans UA159 strains biofilms. Green, bacteria (SYTO 9); red, EPS (Alexa Fluor 647). (B) The distributions of EPS and bacteria at each layer. Quantification of bacteria/EPS biomass was performed with COMSTAT and the ratio of EPS to bacteria at different layers was also quantified.

