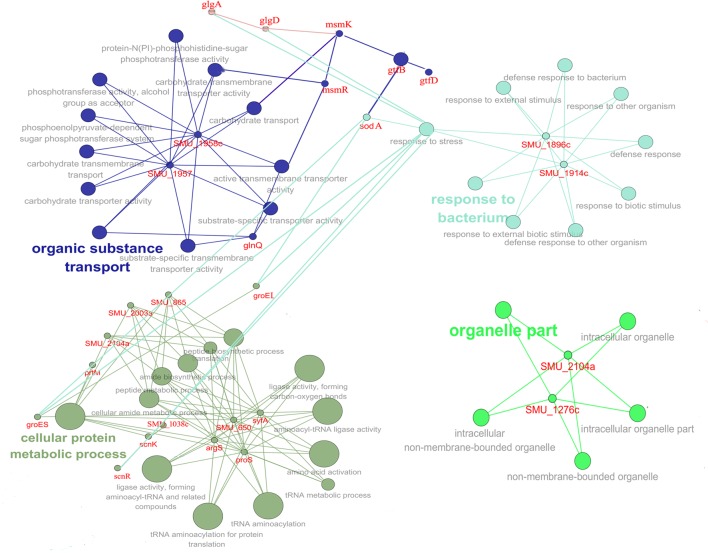
FIGURE 6.
Protein network analysis of the DEGs (lmrB mutant versus S. mutans UA159 wild type). The interaction data was obtained from the STRING database and interaction network was analyzed by local CYTOSCAPE software. Four protein interaction networks were identified as indicated by different colors.

