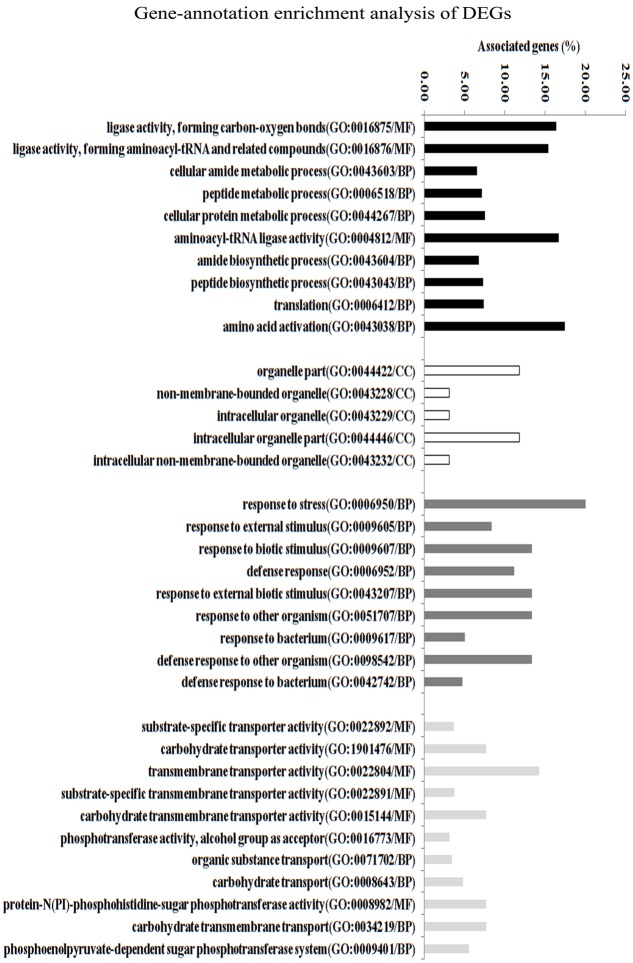
FIGURE 7.
Transcriptome analysis of S. mutans UA159 strains (lmrB mutant versus S. mutans UA159 wild type). Gene ontology enrichment analysis of the DEGs was obtained based on protein network analysis. Four interaction networks represented by different colors were identified among 107 DEGs. The DEGs in GO term response to stress and in GO term TM transporter activity reached 20.6 and 15.8%; GO, gene ontology; BP, biological process; MF, molecular function; CC, cellular component.

