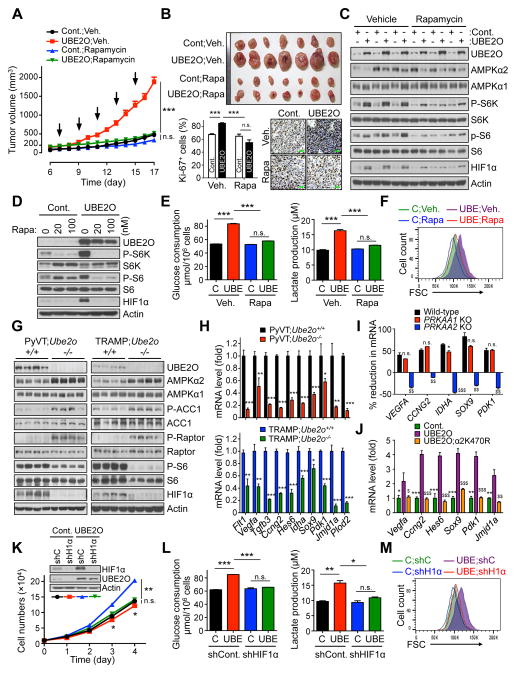
Figure 6. AMPKα2/mTOR/HIF1α axis is key to UBE2O dependent tumor biology.
(A) Tumor volumes of mouse allograft implanted with E1A+H-RasV12 MEFs overexpressing UBE2O treated with rapamycin (i.p. 4 mg/kg, indicated by arrows) were measured at different day. n = 7.
(B) Representative images, immunohistochemical analysis of Ki-67, and quantification of Ki-67 positive cells of mouse allograft tumors from (A). Scale bars, 75 μm. n = 6.
(C) Lysates from (A) were subjected to immunoblotting.
(D) Lysates from transformed MEFs overexpressing UBE2O treated with rapamycin at the indicated concentrations for 24 hr were subjected to immunoblotting.
(E) Glucose consumption and lactate production by transformed MEFs overexpressing UBE2O treated with rapamycin (100 nM) for 24 hr were determined by enzymatic assay. n = 3.
(F) FSC levels of transformed MEFs overexpressing UBE2O treated with rapamycin (100 nM) for 24 hr were determined by flow cytometry.
(G) Lysates from mammary tissues of 90 days old PyVT;Ube2o+/+ and PyVT;Ube2o−/− mice (left) or anterior prostate lobes of 12 weeks old TRAMP;Ube2o+/+ and TRAMP;Ube2o−/− mice (right) were subjected to immunoblotting.
(H) The mRNA level of HIF1α target genes in mammary tumors of 105 days old PyVT;Ube2o+/+ and PyVT;Ube2o−/− mice or in prostate tumors of 30 weeks old TRAMP;Ube2o+/+ and TRAMP;Ube2o−/− mice were measured by RT-qPCR. n = 3.
(I) Total RNAs from HAP1 control or HAP1 cells knocked out (KO) for PRKAA1 or PRKAA2 using CRISPR/Cas9 technology expressing UBE2O shRNA were subjected to RT-qPCR. % reduction formula is the decrease in mRNA levels of UBE2O-depleted cells over those of control cells. n = 3. n.s. (non-significant), *p<0.05, PRKAA1 KO vs. WT; $$p<0.01, $$$p<0.001, PRKAA2 KO vs. WT.
(J) Total RNAs from E1A+H-RasV12 MEFs overexpressing UBE2O together with K470R AMPKα2 mutant were subjected to RT-qPCR. n = 3. *p<0.05, **p<0.01, ***p<0.001, UBE2O vs. Cont.; $$p<0.01, $$$p<0.001, UBE2O vs. UBE2O;α2K470R.
(K) Immunoblots and growth curves of transformed MEFs overexpressing UBE2O together with HIF1α shRNA.
(L) Glucose consumption and lactate production by transformed MEFs overexpressing UBE2O together with HIF1α shRNA were determined by enzymatic assay. n = 3.
(M) FSC levels of transformed MEFs overexpressing UBE2O together with HIF1α shRNA were determined by flow cytometry.
Error bars represent +/− SEM. p value was determined by ANOVA (A) or Student’s t test (n.s., non-significant; *p<0.05; **p<0.01; ***p<0.001). See also Figures S6.

