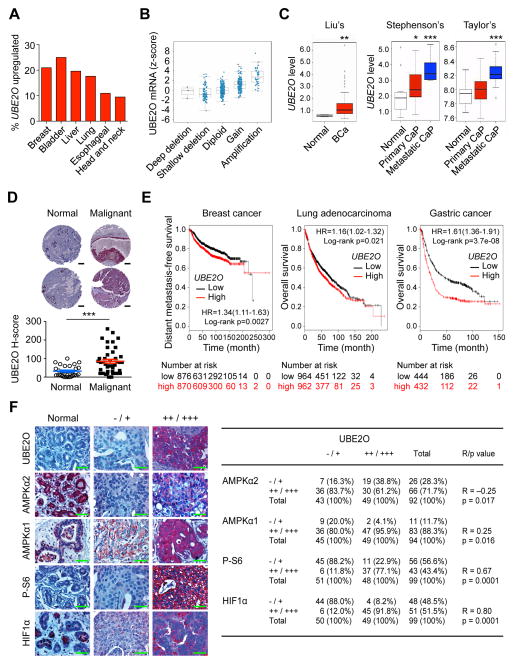
Figure 7. UBE2O expression is increased and correlates with AMPKα2/mTOR/HIF1α in human cancers.
(A) TCGA database analysis available from cBioportal for UBE2O expression in human cancers.
(B) 17q25.1 copy number compared to gene expression for UBE2O mRNA versus copy number in human breast cancer using the cBioportal database. The line in the middle, upper and lower of the boxplot represents the mean, upper and lower quartile of the relative mRNA level of all samples, respectively. The lines above and below the box are the maximum and minimum values. Data points beyond the whiskers (>1.5 interquartile ranges) are drawn as individual dots.
(C) UBE2O expression in human cancers using previously published microarray database. Liu’s BCa, breast carcinoma, (GEO: GSE22820, n = 176); Stephenson’s CaP, prostate carcinoma, (Stephenson et al., 2005, n = 97); Taylor’s CaP (GEO: GSE21032, n = 179). The line in the middle, upper and lower of the boxplot represents the mean, upper and lower quartile of the relative mRNA level of all samples, respectively. The lines above and below the box are the maximum and minimum values. Data points beyond the whiskers (>1.5 interquartile ranges) are drawn as individual dots.
(D) Representative images (top) and quantification (bottom) of immunohistochemical analysis of human breast tissue microarrays for UBE2O protein. Scale bars, 200 μm. n = 72.
(E) Online analysis of survival in breast cancer (n = 1746), lung adenocarcinoma (n = 1926) or gastric cancer (n = 876) patients with high or low UBE2O expression. The number of surviving patients at different time points is indicated below the graphs. HR, hazard ratio.
(F) Immunohistochemical analysis of UBE2O, AMPKα2, AMPKα1, P-S6 and HIF1α proteins in human breast tumor samples (left). Scale bars, 50 μm. Correlation between the indicated protein levels was determined by the PASS Pearson Chi-Square test (right). n = 99. R, correlation coefficient.
Error bars represent +/− SEM. p value was determined by Log-rank (Mantel-Cox) test (E), Chi-square test (F) or Student’s t test (*p<0.05; **p<0.01; ***p<0.001). See also Figures S7.

