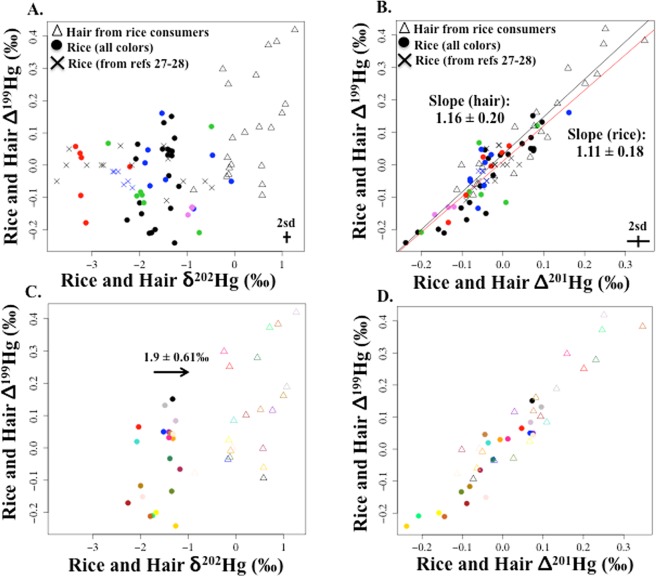
Figure 1.
For rice and hair samples: (a) Δ199Hg versus δ202Hg and (b) Δ199Hg versus Δ201Hg, and simple linear regression (slope ±2 standard error) for rice (red line) and hair (black line) from this study. In graphs (a) and (b), rice from this study = closed circles (n = 45) and hair from this study = open triangles (n = 21). Legend for closed circles: black (Daxin, China), blue (Wanshan, China), green (Indonesian background sites), red (Indonesian artisanal and small scale gold mining sites), and pink (Arkansas, U.S.). Rice Hg isotope values from other studies include black ×’s27 and blue ×’s.28 Representative values for 2 standard deviations (sd) of analytical uncertainty measured for this study are shown in (a) and (b). Figures (c) and (d) are for the same parameters as in (a) and (b), respectively, including just the paired rice samples (closed circles) and hair samples (open triangles) from Daxin, China (n = 21 pairs) with corresponding colors for each pair. Figure 1c includes the difference between hair and rice δ202Hg (average ±1 SD = 1.9 ± 0.61‰).

