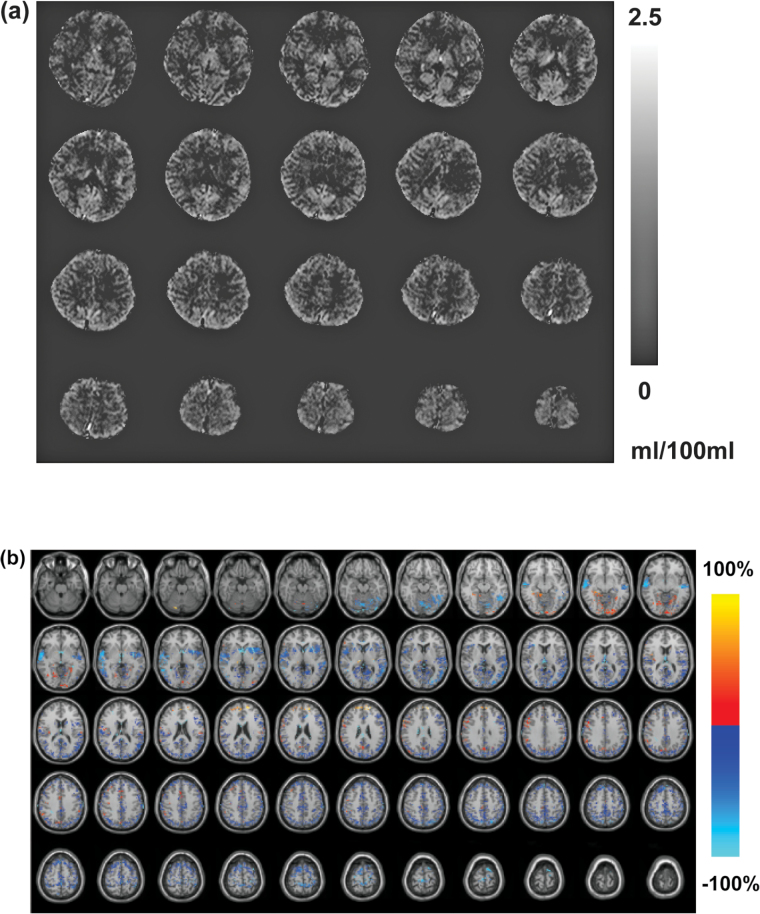
Fig. 1.
(a) Representative whole brain arteriolar cerebral blood volume (CBVa) map (ml blood/100ml brain tissue) calculated from the inflow-based vascular-space-occupancy (iVASO) images from 1 subject. (b) Map of relative CBVa changes between schizophrenia patients and control subjects overlaid on Montreal Neurological Institute (MNI) normalized anatomical images. The relative change is defined as [100 × (schizophrenia − control)/control] %. Only voxels that show significant CBVa difference between the 2 groups (adjusted P < .05) are highlighted.

