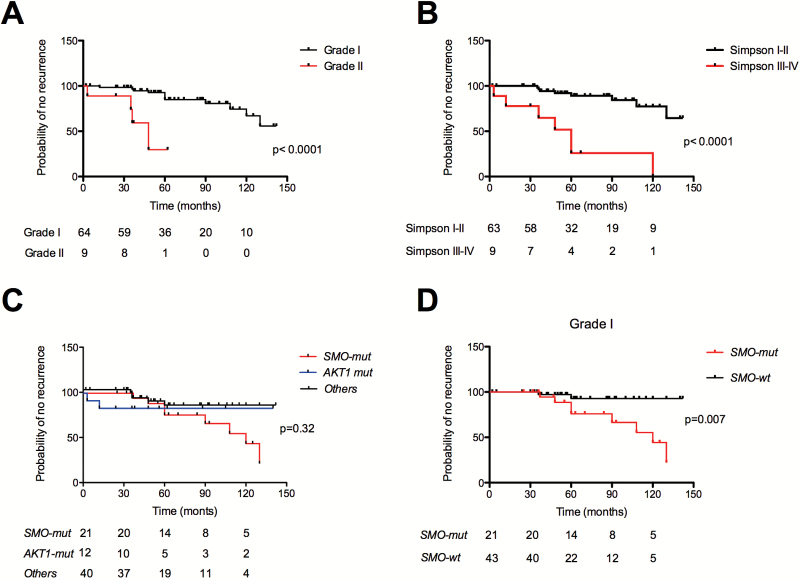
Fig. 2.
Kaplan–Meier plots of time to recurrence, according to (A) WHO grade (grade I vs grade II, P < .0001); (B) extent of resection (Simpson I–II vs Simpson III–IV, P < .0001); (C) molecular subgroups for the whole cohort (SMO-mutant [SMO-mut], AKT1-mutant [AKT1-mut] and “others” meningiomas [P = .32, NS]), and (D) for grade I only: SMO-mutants have a poorer prognosis than SMO-wt (P = .008). wt = wildtype.

