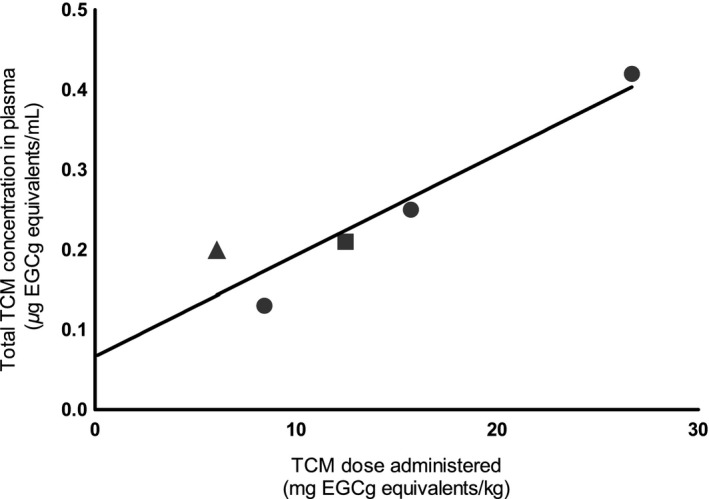
Figure 11.

Quantitative relationship between total TCM concentration in plasma and applied dose in humans. TCM dose metrics, expressed in μg EGCg equivalents/mL plasma or g of PE, are calculated using the concentration addition model of ATSDR (2004). ● represents total TCM concentrations in the plasma of humans after consuming 400, 800, or 1200 mg PE (Chow et al. 2005); ▲ and ▄ represent total TCM concentrations in the plasma of humans after consuming 20 mg/kg of green tea solids (Lee et al. 2002) and 600 mg of PE (Chow et al. 2001), respectively.
