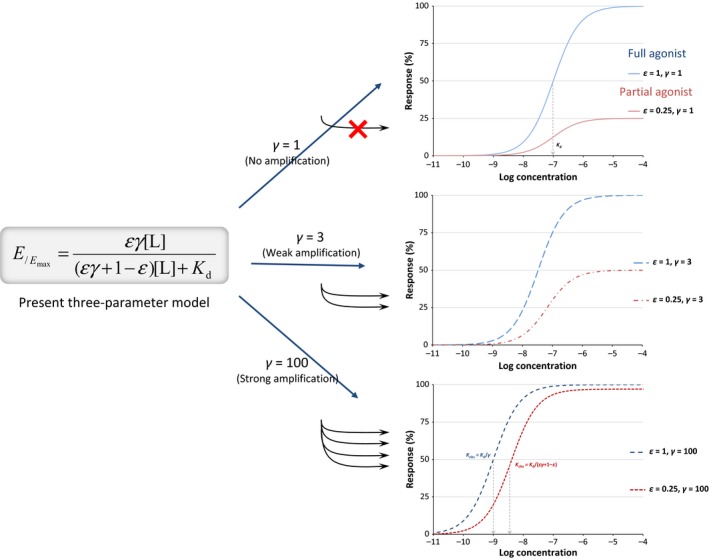
Figure 6.

Response curves with the present three‐parameter model (eq. 31) for a ligand of 100 nmol/L binding affinity (K d = 10–7 mol/L) that is a full agonist (ε = 1, blue lines) or partial agonist (ε = 0.25, red lines) at different post‐activation amplifications, γ = 1 (no amplification), 3, and 100.
