
Figure 7.
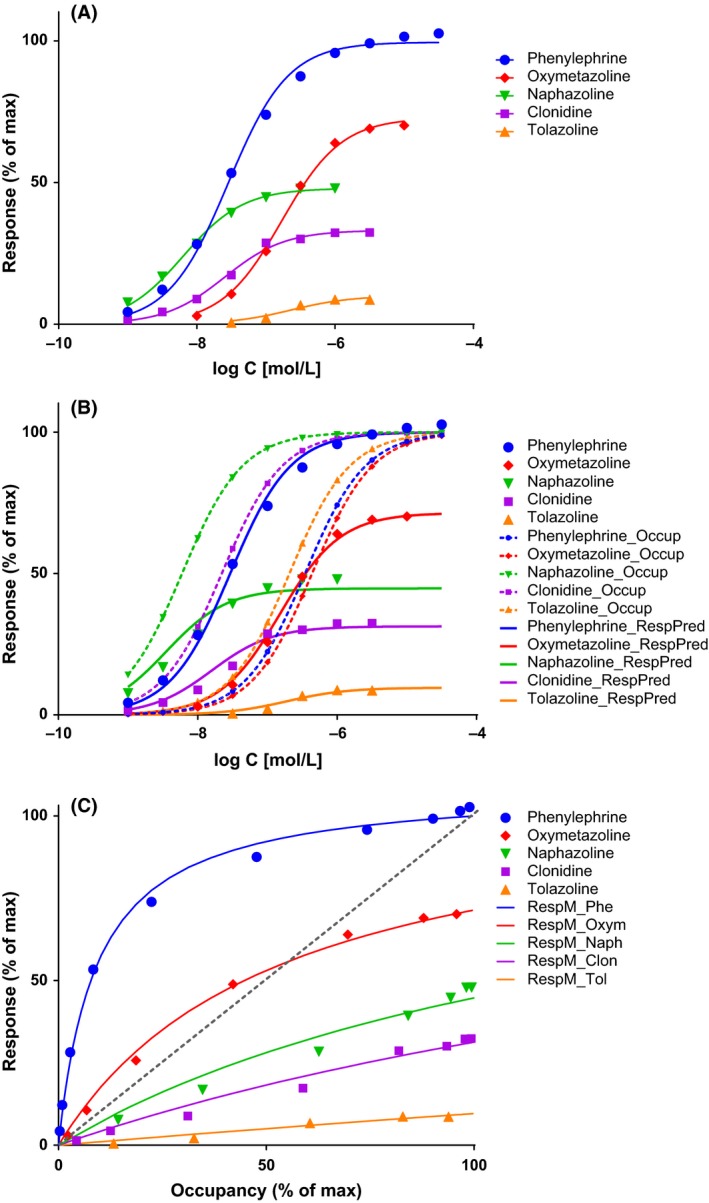
Fit of complex dose–response data obtained with partial agonists where the fractional response can either exceed or lag behind the fractional receptor occupancy. Data are for a series of imidazoline‐type α‐adrenoceptor agonists with response (contraction of isolated rat aorta) shown relative to the maximal one caused by phenylephrine, a full agonist (data after (Ruffolo et al. 1979)). Fractional receptor occupancy values used here are calculated from the average equilibrium dissociation constants (K d) determined for the receptor binding by two different methods (Ruffolo et al. 1979). (A) Fractional response as a function of log concentration for five compounds (symbols) fitted by three different methods (lines). The three different methods (standard E max–eq. 9, present model with no amplification–eq. 26, and operational model–eq. 19; see Table 1 B, C, and D) give identical fits and, hence, overlapping lines. (B) Same data fitted with the present model (eq. 31) using the independently derived K d values for the binding (dotted lines) and fitting the response data by adjusting only the common γ (gain) and the individual ε (efficacy) parameters (Table 1). Fractional receptor occupancy data are also shown as dashed lines to highlight the ability of the model to account for the mismatch between fractional response and occupancy. (C) Fractional response vs. occupancy data for these five compounds (symbols) and their corresponding fit with the present model (curved lines).