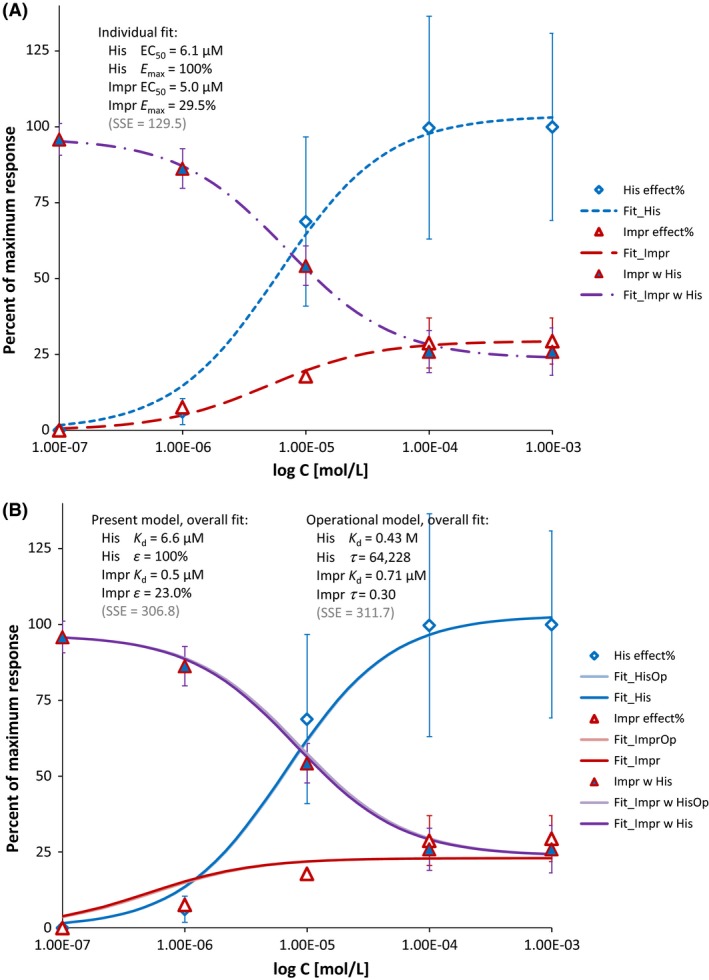
Figure A1.

Illustration of full, partial, and competitive partial agonism with the often used example of histamine and impromidine, H2‐receptor agonist acting on isolated ventricular strips from human myocardium; data after (English et al. 1986). Concentration–responses shown are for histamine alone (blue symbols), impromidine alone (red symbols), and impromidine in the presence of a constant concentration (100 μmol/L) of histamine (purple symbols). As a partial agonist, impromidine alone can only produce a maximal response that is far less (~30%) than that obtainable with histamine, and when used in combination, it can displace the full agonist and actually produce a reduction in the overall response. Data were fitted with three individual curves separately using GraphPad Prism (A) and with a single set of parameters using the operational model (eq. 19 and 41) and the present model (eq. 31 and A12, assuming γ = 1 to avoid overparametrization and have the same number of parameters as the operational model) and (B). While the quality of fit in B is essentially identical with both models (overlapping light and dark lines; SSE values of 306.8 versus 311.7 as shown in the graphs), the parameter set of the operational model is quite meaningless especially for histamine (e.g., K d = 0.43 mol/L due to the large value of τ obtained by fitting). In the meantime, fit of all three curves with the present model using a single set of parameters results in values (B) consistent with those from the individual fit (A).
