
Figure 1.
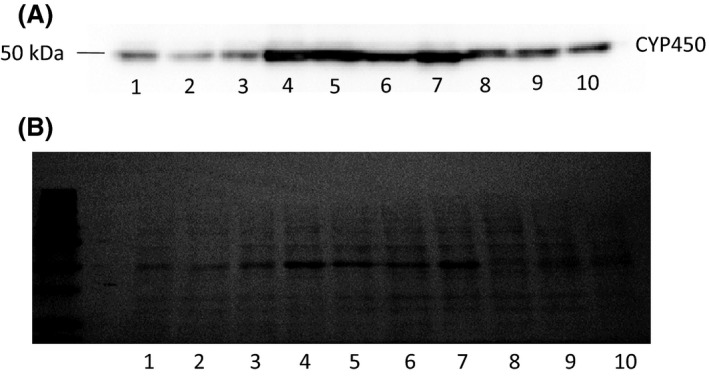
Relative quantification of overexpressed CYP450s in HEK293 microsomes. Panel (A), Detection of V5‐tagged CYP450s by Western blotting. Panel (B), Ponceau total protein staining for CYP450 normalization. Lane 1, CYP2C19; lane 2, CYP2C19Glu92Asp; lane 3, CYP2C19Ile331Val; lane 4, CYP2D6; lane 5, CYP2D6Arg296Cys, Ser486Thr; lane 6, CYP2D6Pro34Ser, Ser486Thr; lane 7, CYP2D6Thr107Ile, Arg296Cys, Ser486Thr; lane 8, CYP3A4; lane 9, CYP3A4Arg162Gln; lane 10, CYP3A5.