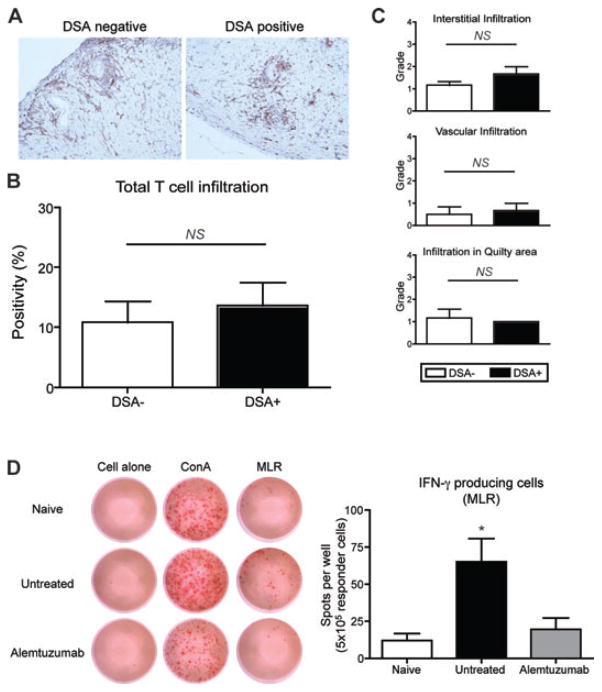
Figure 4. Allospecific T cells in long-term recipients.
A. Representative section of graft from DSA+ and DSA– recipients with alemtuzumab treatment, 100 days after transplantation (CD3 immunohistochemistry). Note the minimal perivascular infiltration of T cells in the graft for both DSA+ and DSA– group without parenchymal rejection. Original magnification ×200. (B) The quantification of T cell infiltration showed similar level of intragraft T cell infiltration (n = 5 per group). (C) Grading of T cell infiltration in different graft compartments showed no difference on T cell infiltration in interstitial, vascular and quilty area (n = 6 per group). (D) IFN-γ producing cells detected by ELISPOT. Splnocytes derived from naïve, untreated and alemtuzumab treated recipients were cocultured with medium alone, ConA (5 μg/mL) or irradiated B6 splenocytes (5 × 10⁶ cells). Splenocytes from alemtzumab treated recipient showed significantly less number of spot compared to cells from untreated recipients (n = 6 per group). NS > 0.05, *p < 0.05.

