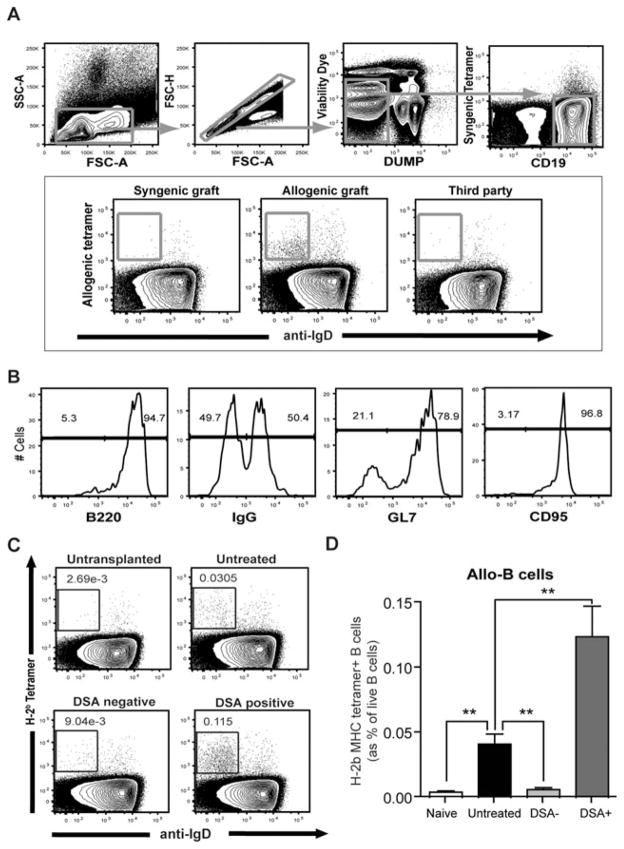
Figure 5. Visualization of alloreactive B cells after cardiac allograft.
(A) Formation of allo-B cells was tracked with donor MHC tetramer (H-2Kb/Db). Gating strategy for allo-reactive B cells was depicted schematically. Splenocytes from syngeneic, allogeneic and allogeneic third party recipients were evaluated. Allo-B cells were found only from allogeneic recipients’ splenocytes. (B) Phenotype of donor MHC tetramer+ B (Allo-B) cells was analyzed with B220, IgG, GL7 and CD95 mAbs. (C) Splenocytes from cardiac allograft recipients were analyzed after 100 days of transplantation. As a control, splenocytes from naïve CD52Tg mice were also evaluated. Dot plots of live B cells were depicted and show the IgD (x-axis) profile of cells stained with donor MHC tetramer (y-axis). (D) Increased allo-reactive (anti-Kb/Db) B cells were identified from untreated and DSA+ recipients. Allo-B cell levels of DSA– recipients showed no difference from those of naïve mice. Allo-B cell levels were significantly higher in DSA+ recipients compared to untreated recipients (n = 5 per each group). **p < 0.01.

