Fig. 3.
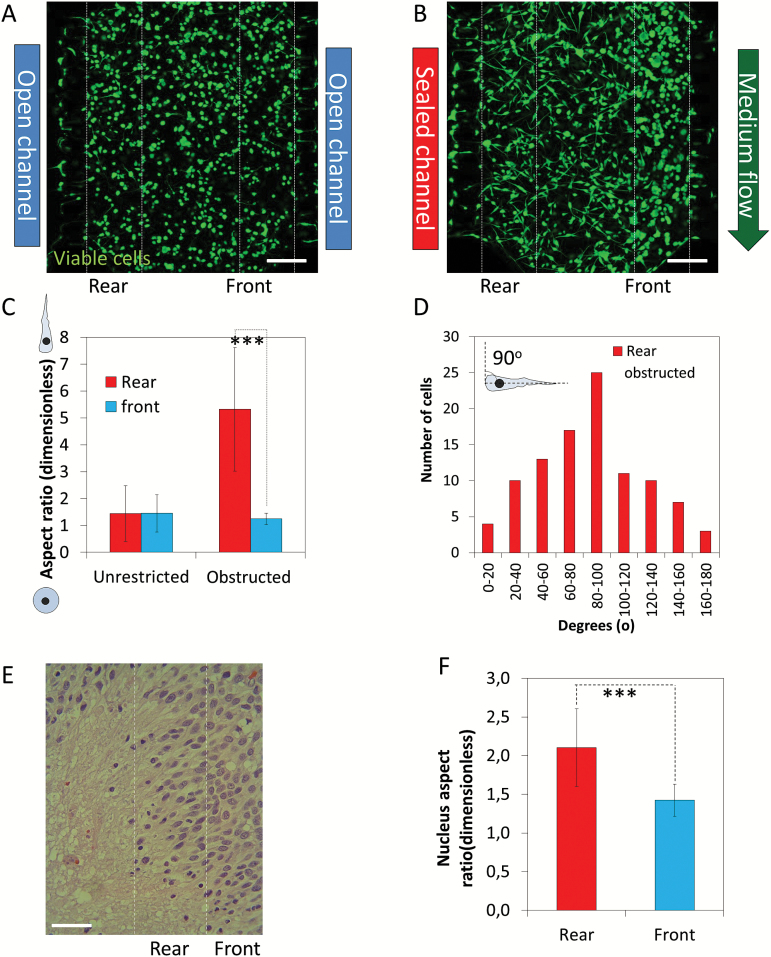
Cell shape during pseudopalisade formation. Confocal images of the microchamber were taken after 5 days in culture under unrestricted (A) or obstructed conditions (B). (C) Cell shape at the pseudopalisade rear and front was analyzed and compared with the same region under unrestricted conditions; *** denotes a statistical difference (P value 1.4x10⁻³²). (D) Directionality at the pseudopalisade rear under obstructed conditions. (E) Hematoxylin and eosin staining of a paraffin-embedded GBM sample. (F) Nucleus aspect ratio in the pseudopalisade rear and front in patient samples; *** denotes a statistical difference (P value 3.7x10⁻⁸). Scale bar is 200 µm.

