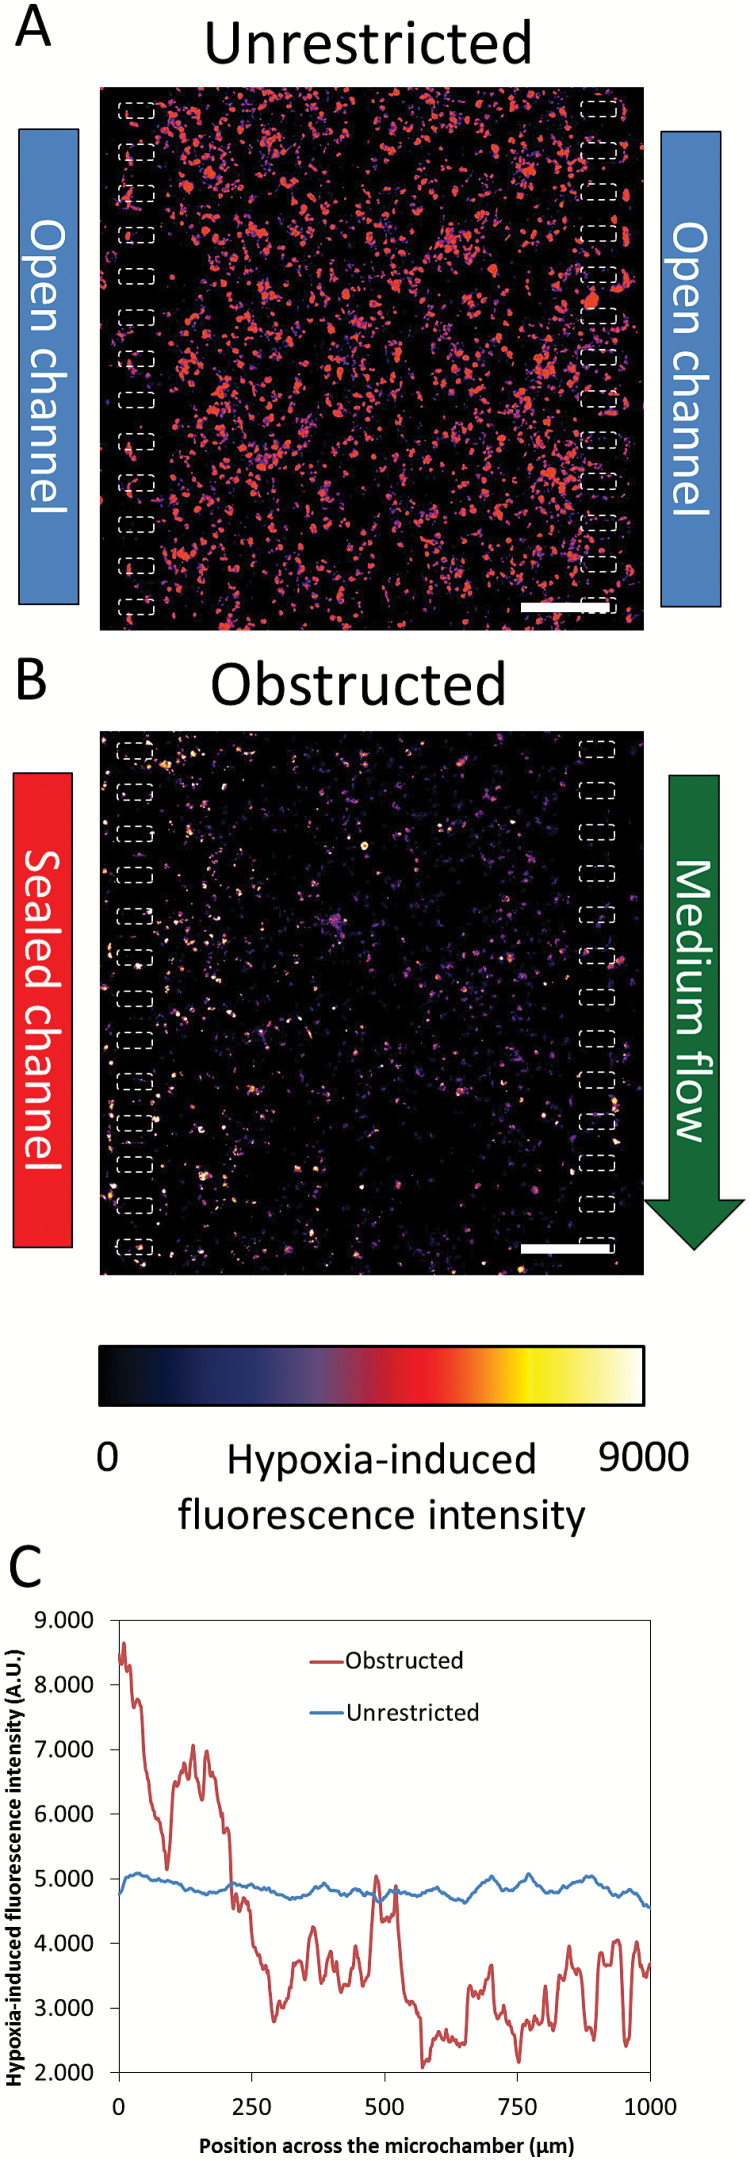
Fig. 5.
Oxygen profile. Oxygen profile was detected after 5 days in culture using Image-it Hypoxia reagent. Images are shown as heat-map hypoxia-induced fluorescence intensity. Hypoxia-induced fluorescence intensity across the microchamber revealed that oxygen concentration was constant under unrestricted conditions (A), whereas an oxygen gradient was established under obstructed conditions (B). The graph shows the hypoxia-induced fluorescence intensity profile across the microchamber (C). Scale bar is 200 µm.

