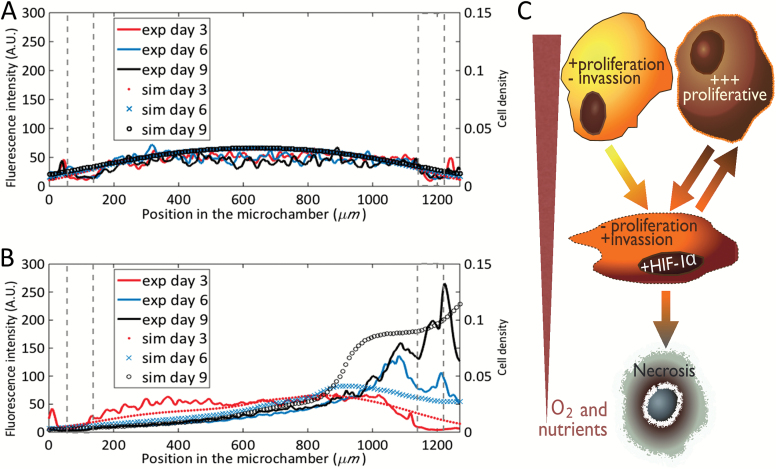
Fig. 6.
Computer simulations versus experimental data of the cell evolution profiles. Simulations of tumor cell density evolution and experimental data of fluorescence intensity within the chamber under unrestricted conditions (A) and under obstructed conditions (B). Left Y axis denotes fluorescence intensity from experiments at days 3, 6, and 9, curves red, blue, and black, respectively. Right Y axis denotes cell density from simulations at days 3, 6, and 9, red spots, blue cross, and black circles, respectively. Post position in the graphs is delimited by gray dashed line. (C) Graphical depiction of the mathematical model scheme based on previous models [10, 13] including 3 cancer cell phenotypes, the oxygenation and the necrosis (C).

