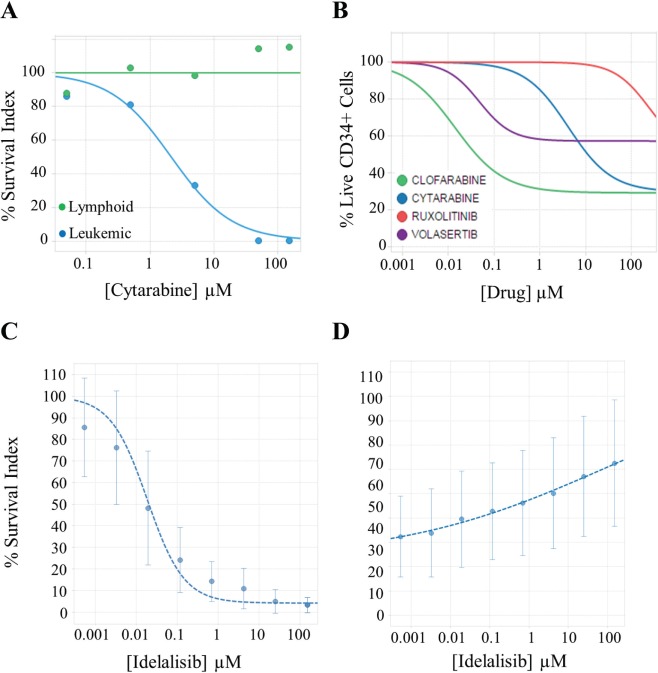
Figure 2.
Dose-response curves from different assays performed by the PharmaFlow platform. (A) Evaluation of the therapeutic index determining the effect of cytarabine in both leukemic and residual mature lymphoid cells in an acute myeloid leukemia sample with the depletion assay. (B) Evaluation of the cytotoxic effects of compounds on CD34+ progenitor cells in NBM samples (n = 10) with the depletion assay. Each line represents the median for four approved drugs. (C, D) Evaluation of the antiproliferative (C) or cytotoxic (D) activity of idelalisib determining selectively the effects in proliferative (C) and whole-cell population (D) with the native environment proliferation assay. Panels C and D represent the median and the standard deviation (vertical error bars) in 19 chronic lymphoid leukemia samples for idelalisib.

