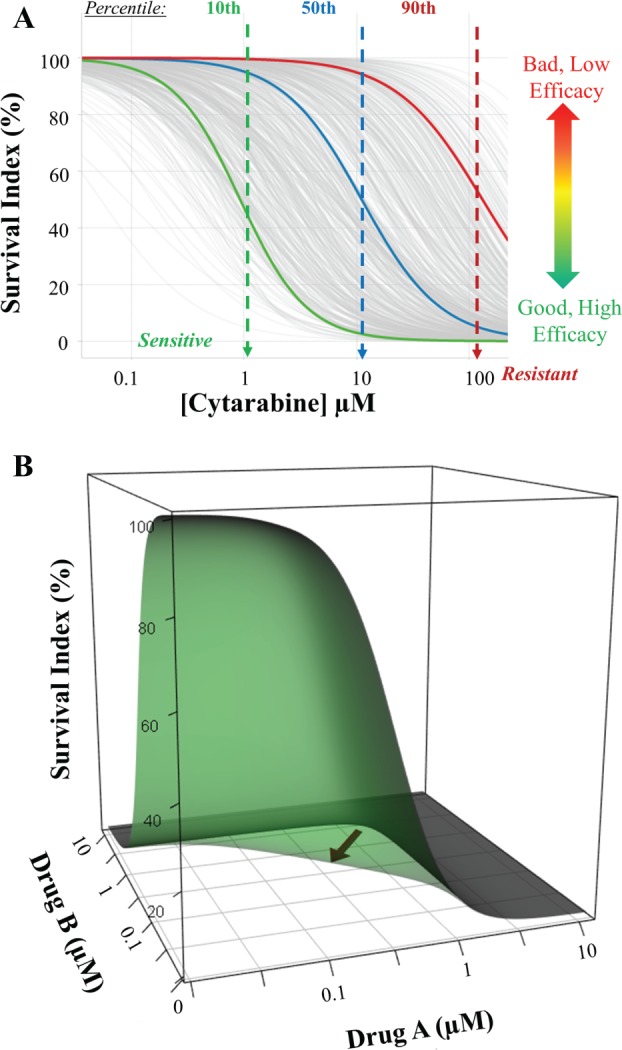
Figure 4.

Pharmacological ex vivo activity across individual acute myeloid leukemia (AML) patients to cytarabine. (A) High interpatient heterogeneity between 463 AML patients (gray lines) to cytarabine after a 48 h incubation period. The blue line depicts the average response. The integration of both potency (EC50) and efficacy (Emax) determines for each individual the in vitro effectiveness of the drug referred to in the population models. (B) Three-dimensional (3D) plots showing the interaction surface models for additive (gray) and synergistic (green) interactions. Synergy is graphically observed through the shift of the surface toward the axis origin. Sigmoidal curves on each side of the 3D object represent the dose-response curve of each single drug.
