
Figure 2. DMF Treatment reduced memory T cells.
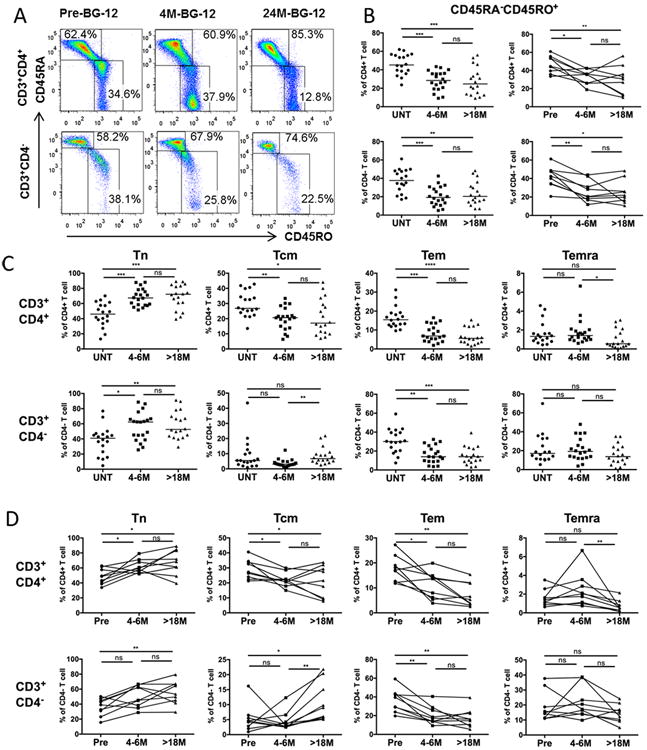
PBMCs were isolated from blood of patients and stained with antibodies specific to surface markers: CD3, CD4, CD45RO, CD45RA and CCR7 in order to analyze subsets of memory cells. (A) Representative profile depicting the frequencies of memory and non-memory phenotypes among CD4+CD3+ T cells (top panels) and CD3+CD4- T cells (lower panels) from an RRMS patient prior to DMF treatment, and after 4-6 months and >18 months of continuous DMF treatment (B) Frequencies of memory (CD45RA-/CD45RO+) fractions as a percentage of CD3+CD4+ (upper panels) and CD3+CD4- (lower panels) T cells in cross-sectional (left-hand panel) untreated (UNT, n=18), 4-6 month DMF-treated (4-6M, n=20), and 18-26 month (>18M, n=18) DMF-treated groups; as well as longitudinal cohort (n=9, right hand panel) (C) Frequencies of naïve Tn (CD45RO-CCR7+), central memory Tcm (CD45RO+CCR7+), effector memory Tem (CD45RO+CCR7-), and CD45RA+ effector memory Temra (CD45RO-CCR7-) of CD3+ CD4+ (upper panels) and CD3+CD4- (lower panels) T cells in three cross-sectional patient groups. Scatter plots show data for individual patients as dots and the median of each group as a line. P-values from Kruskal-Wallis ANOVA with Dunn's multiple comparison tests are shown above the data for each cell type. (D) Tn, Tcm, Tem, and Temra cells as a percentage of CD3+CD4+ (upper panels) or CD3+CD4- (lower panels) T cells in the longitudinal cohort at the three time points. P values from Friedman test with Dunn's multiple comparisons for pair-wise time points are shown above the data for each cell type. *P < 0.05; **P < 0.01; ***P < 0.001; ns, not significant.