
Figure 4. DMF specifically reduced Th1 and Th17, particularly those expressing CXCR3 and CD161, but increased Th2 cells.
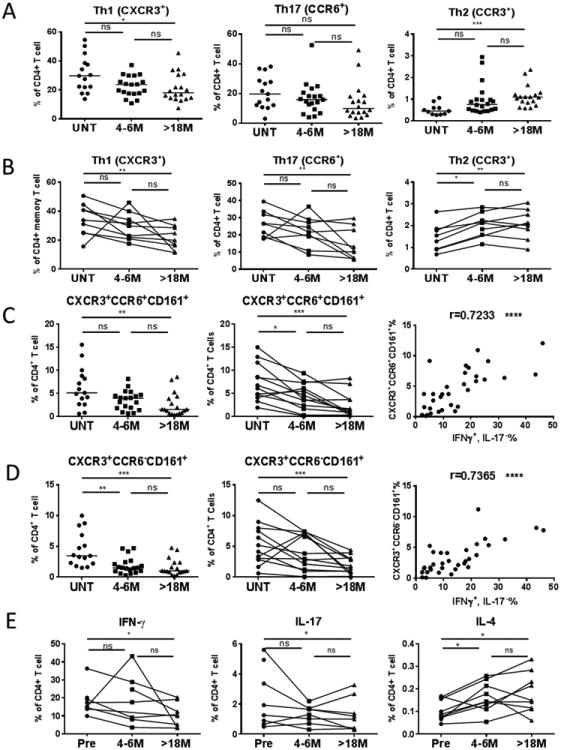
PBMCs from patients were stained with antibodies against CD3, CD4, CXCR3, CCR6, CCR3, and CD161 to evaluate frequencies of CXCR3+ (Th1), CCR6+ (Th17) of CD4+ T cells (UNT: n=15; 4-6M: n=19; >18M: n=18). The CCR3+ (Th2) of total CD4+ T cells were also analyzed (UNT: n=11, 4-6M: n=20, >18M: n=18). These frequencies were plotted as dots at three time points with the median of each group as a line in three cross-sectional groups (A) or in the longitudinal cohort (B). DMF effects on the frequencies of CD4+ T cells expressing CD161and CXCR3 with (C) or without (D) CCR6 in cross sectional (left-hand panels) and longitudinal (middle panels) studies, and corresponding correlation (right-hand panels) with frequencies of CD4+ T cells producing IFNγ but not IL-17. (E) IFNγ (left-hand panel) and IL-17 (middle panel) production by CD4+ T cells was analyzed in our longitudinal study following stimulation of PBMCs with PMA and ionomycin for 6 hours in the presence of brefeldin A. Cells were then stained with fluorochrome-conjugated antibodies against CD3, CD4, followed by intracellular staining of antibodies against IFNγ, IL-17A and IL-17F. IL-4 (right-hand panel) production was measured from ex vivo PBMC without further in vitro stimulation since it was clearly detectable (Suppl Fig 1B). PBMC were incubated in complete RPMI for 24hrs with brefeldin A added in the last 6 hours of culture. Cells were then stained with fluorochrome-conjugated antibodies against CD3, CD4, followed by intracellular staining with antibodies against human IL-4. P-values from Kruskal-Wallis ANOVA with Dunn's multiple comparison tests are shown above the data for each cell type group. *P < 0.05; **P < 0.01; ***P < 0.001; ns, not significant.