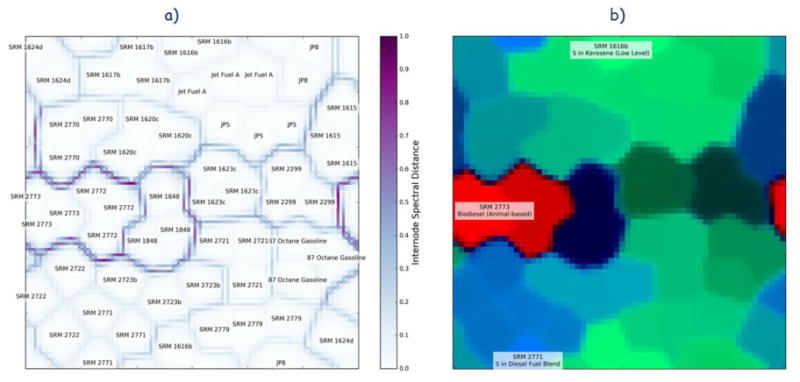
Figure 7.

(a) Unified distance matrix for the self-organizing map, with corresponding locations for the sixty samples. (b) False-color map of Hellinger distances from each node to various samples on the map. The red channel corresponds to map nodes closer to SRM 2273, the green channel to SRM 2771, and the blue channel to SRM 1616b. Therefore, nodes that are more red, for instance, will be closer in data space to SRM 2273 and therefore be representative of biodiesels.
