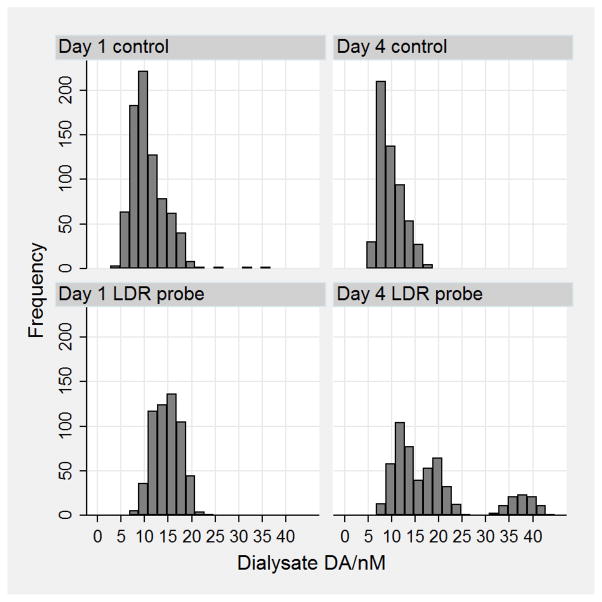
Figure 3.
Frequency distributions of the basal concentrations measured each minute for the four conditions day = 1 and 4, probe = control and LDR. Note there are seven animals represented in day 1 control. There are five animals contributing data for the other three cases. The “frequency axis” represents single, one-minute measurements.

