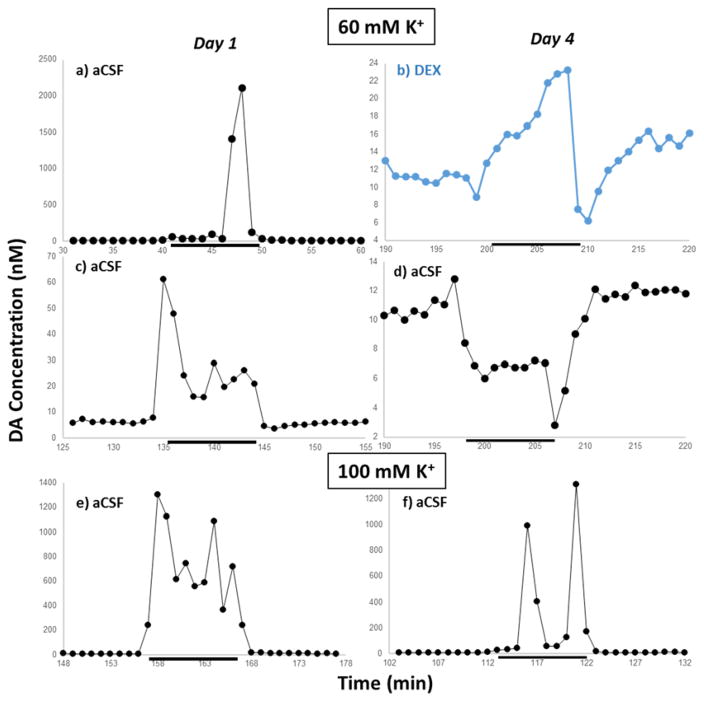
Figure 4.
Qualitatively distinct dialysate DA responses observed during the experiments. Left: day 1. Right: day 4. Top: (a–d) 60 mM K+. Bottom: (e–f) 100 mM K+. The example in blue is from an LDR probe. The group is selected to be representative to transient characteristics, not conditions. K+ stimulations are denoted by the black bar. Note the differing vertical scales. A complete set of images of all transients observed can be found in the Supporting Information, Figs. S2 – S23.

